According to IBIS World, the number of businesses in the chain restaurant industry in the US has grown by 2.1% per year on average between 2018 and 2023.
This steady growth reflects how chain restaurants in the US have thrived even amidst challenges such as economic fluctuations and the recent pandemic.
In this blog, we analyze the performance of top US restaurant chains, exploring their sales revenue, number of locations, brand popularity, and geographic distribution across states with varying GDPs.
The data for this analysis was gathered from the ScrapeHero Data Store.
You can easily download accurate, updated, affordable, and ready-to-use POI location data instantly from ScrapeHero Data Store.
Power Location Intelligence with Retail Store Location Datasets
Access thousands of global brands and millions of POI location data points ready for instant purchase and download.
The Big Three Among the US Restaurant Chains
Before delving into the different aspects of the top chain restaurants in the US, it is essential to see who the big players are in terms of revenue.
McDonald’s leads the industry by a significant margin, generating $53.1 billion in sales.
If you want a complete list of all McDonald’s restaurant locations in the US, click here.
Starbucks and Chick-fil-A hold the second and third spots.
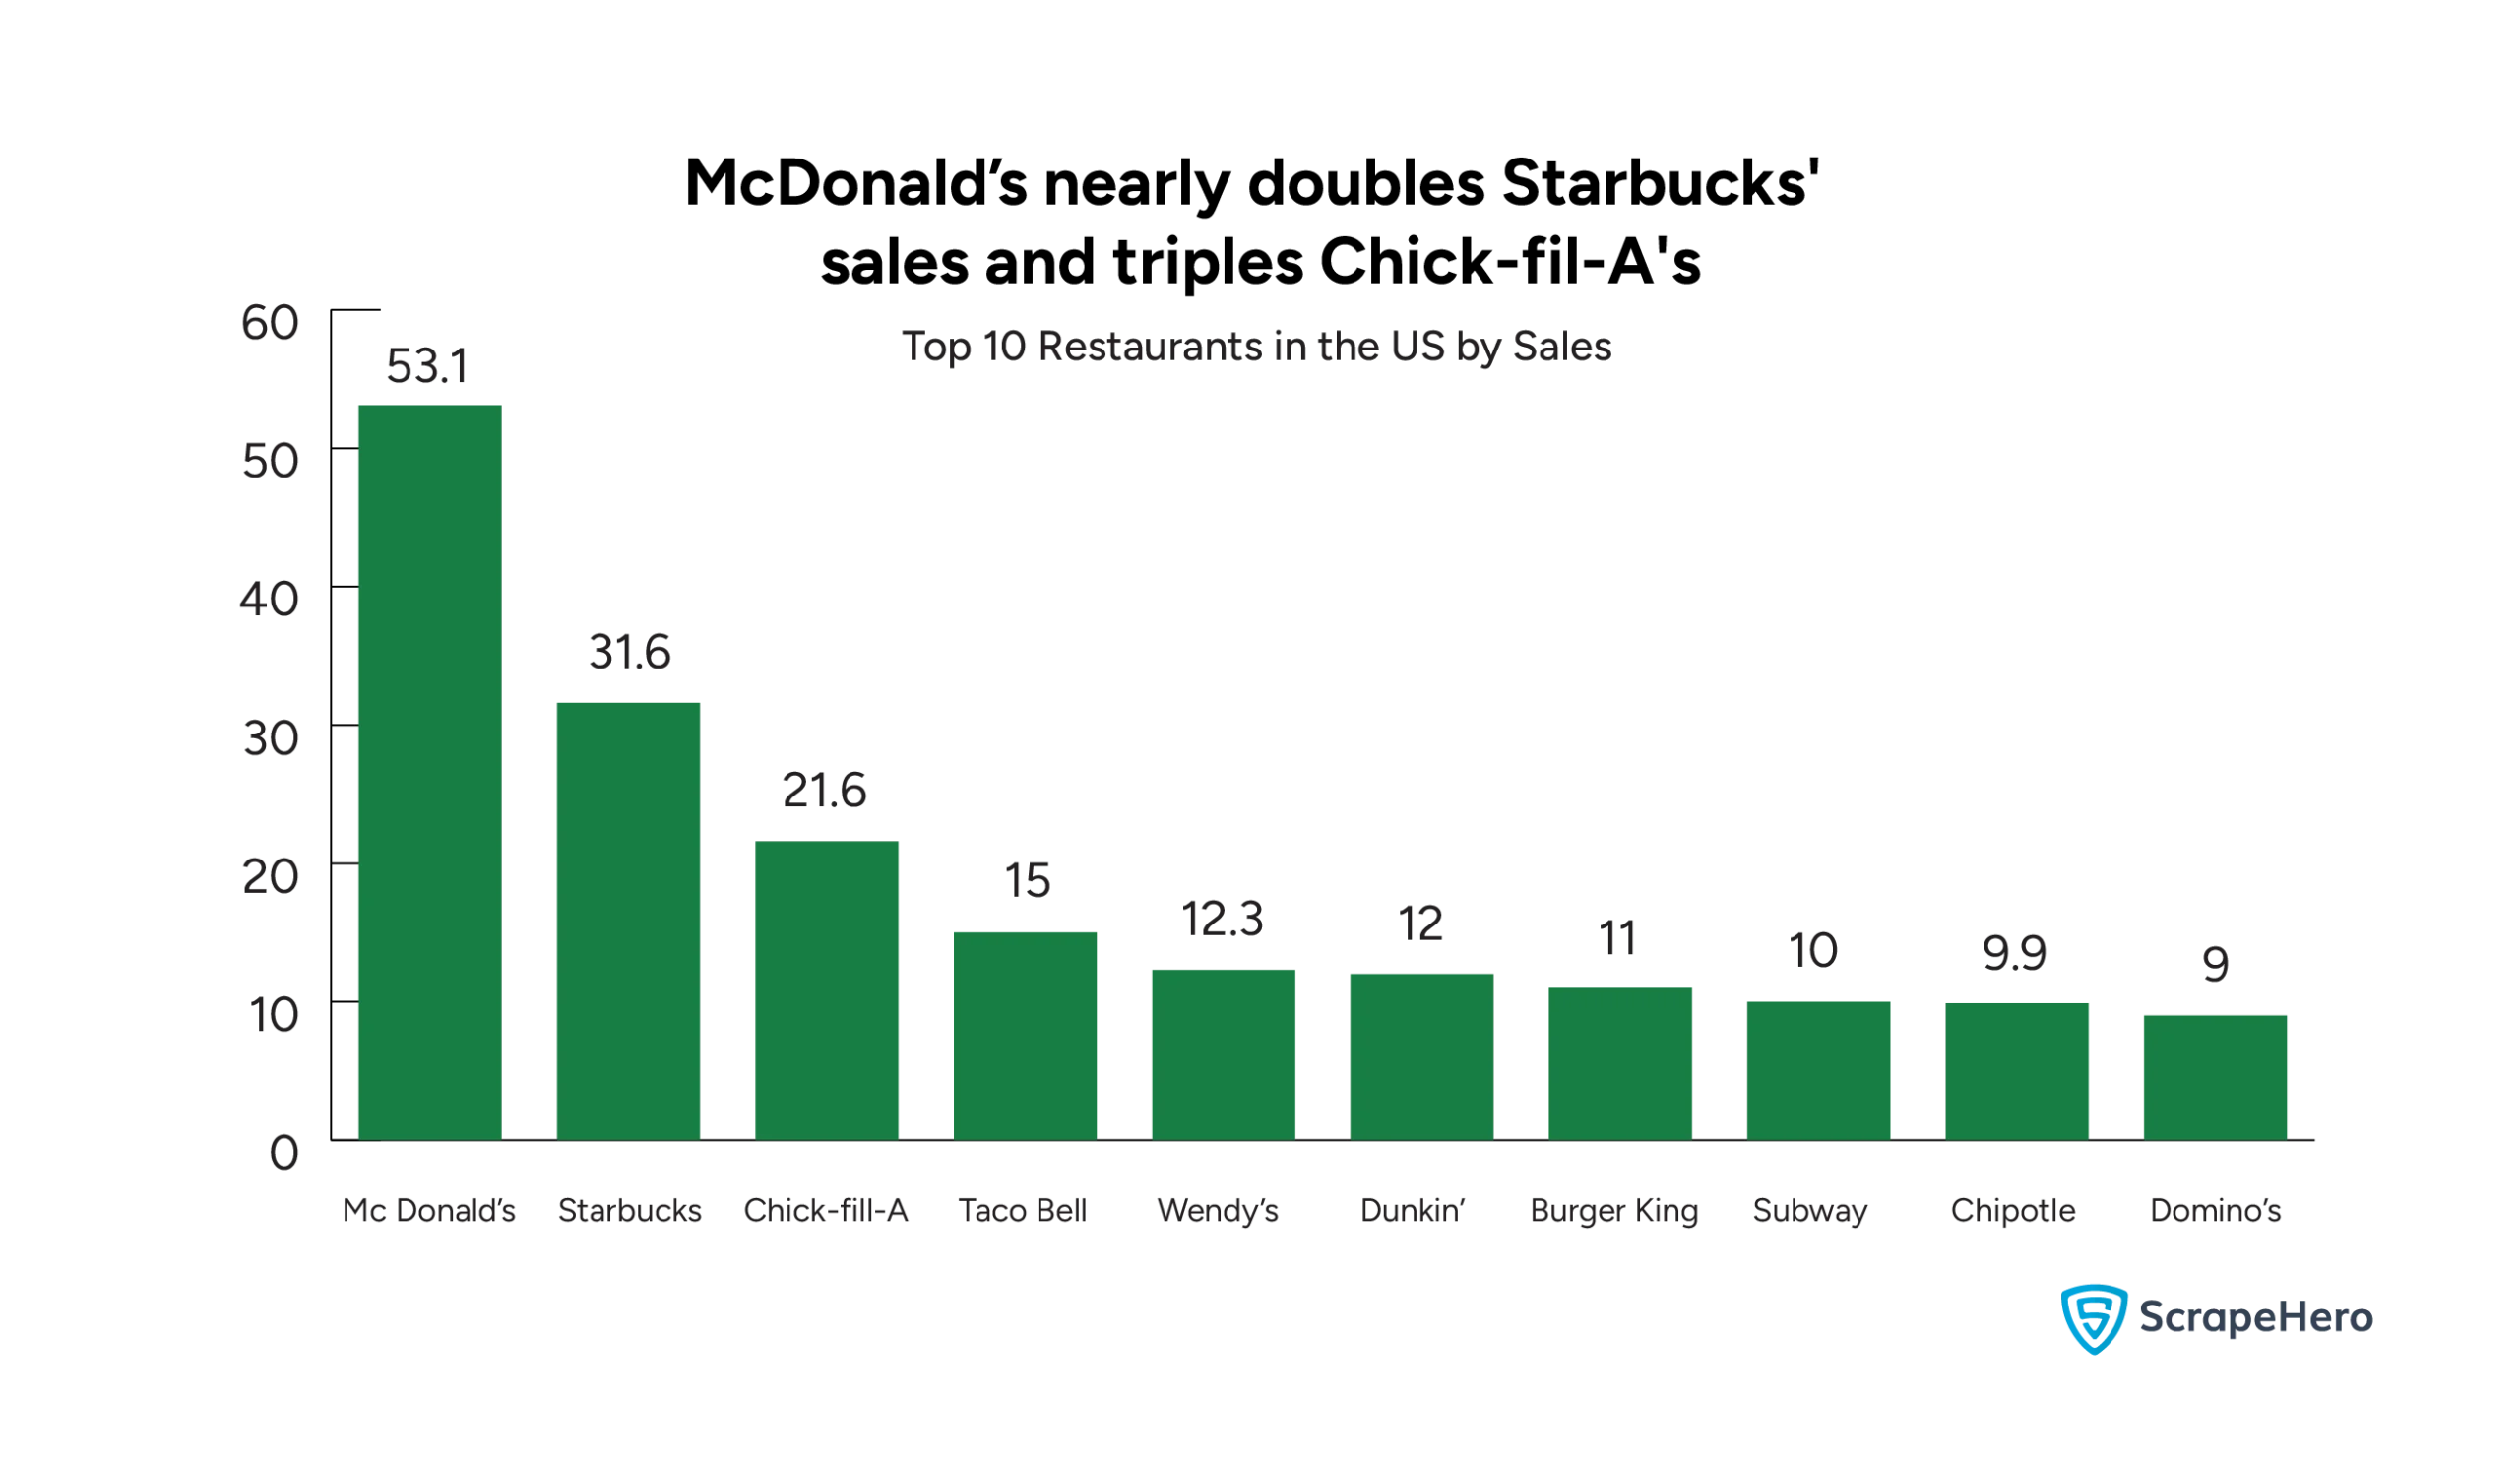
The middle group includes Taco Bell ($15 billion), Wendy’s ($12.3 billion), Dunkin’ ($12 billion), and Burger King ($11 billion), which have relatively similar sales figures.
Subway ($10 billion), Chipotle ($9.9 billion), and Domino’s ($9 billion) occupy the lower end of the top 10 but still maintain strong national footprints.
An interesting observation to make here is that the list is heavily dominated by fast food and quick-service restaurants.
While sales figures give you an idea about how well a chain restaurant is doing, you can only complete the picture by looking at what customers are saying about it.
Location, Location, Location: A Battle For Territory
Now is the time for an analysis of the US restaurant chains with respect to their store count.
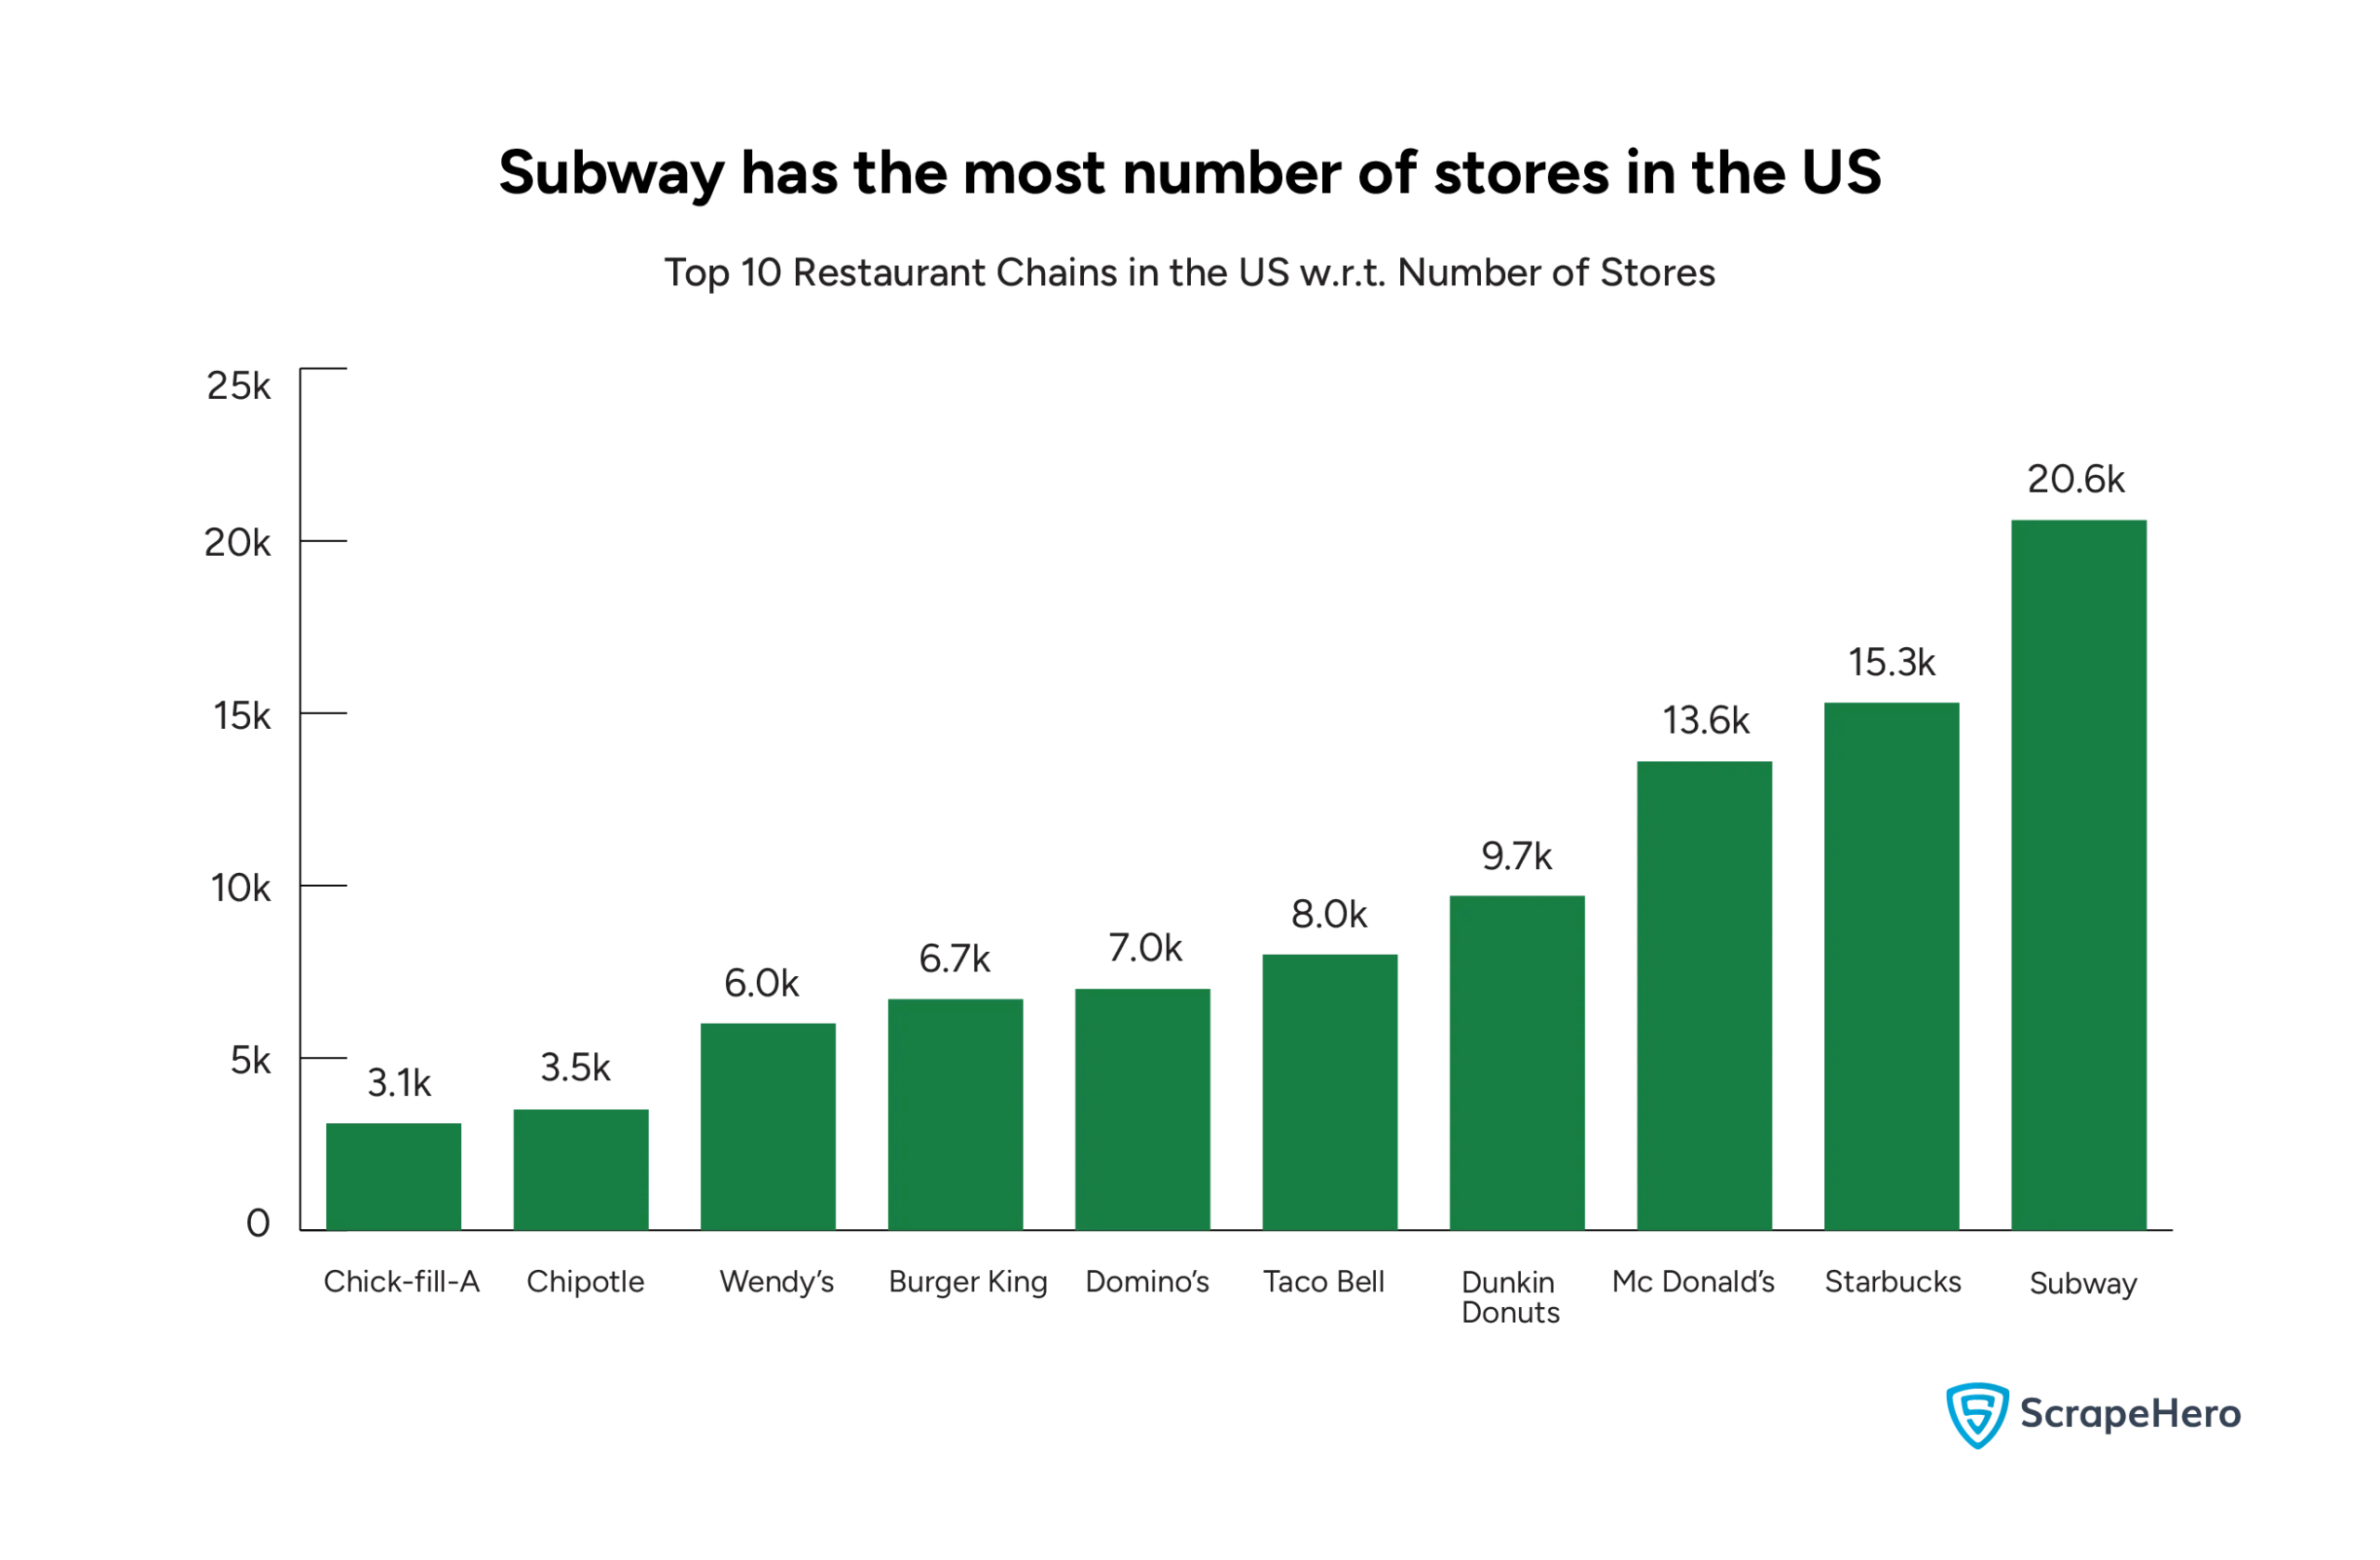
Subway has the highest number of locations, with 20.6K stores. Download all the Subway store locations here.
Starbucks (15.3K) and McDonald’s (13.6K) follow Subway.
Dunkin’ Donuts (9.7K), Taco Bell (8.0K), Domino’s (7.0K), and Burger King (6.7K) maintain solid footprints.
Wendy’s (6.0K), Chipotle (3.5K), and Chick-fil-A (3.1K) have fewer locations compared to the others on the list.
When compared with the previous graph, which is part of our restaurant chain analysis, Subway leads in locations but ranks lower in sales compared to McDonald’s, Starbucks, and Chick-fil-A. This suggests that more locations don’t always translate to higher revenue.
Despite having the fewest locations, Chick-fil-A is one of the highest revenue generators, showing a quality-over-quantity approach.
Now, among the top four chain restaurants, Subway, leads in most states, reflecting its extensive presence.
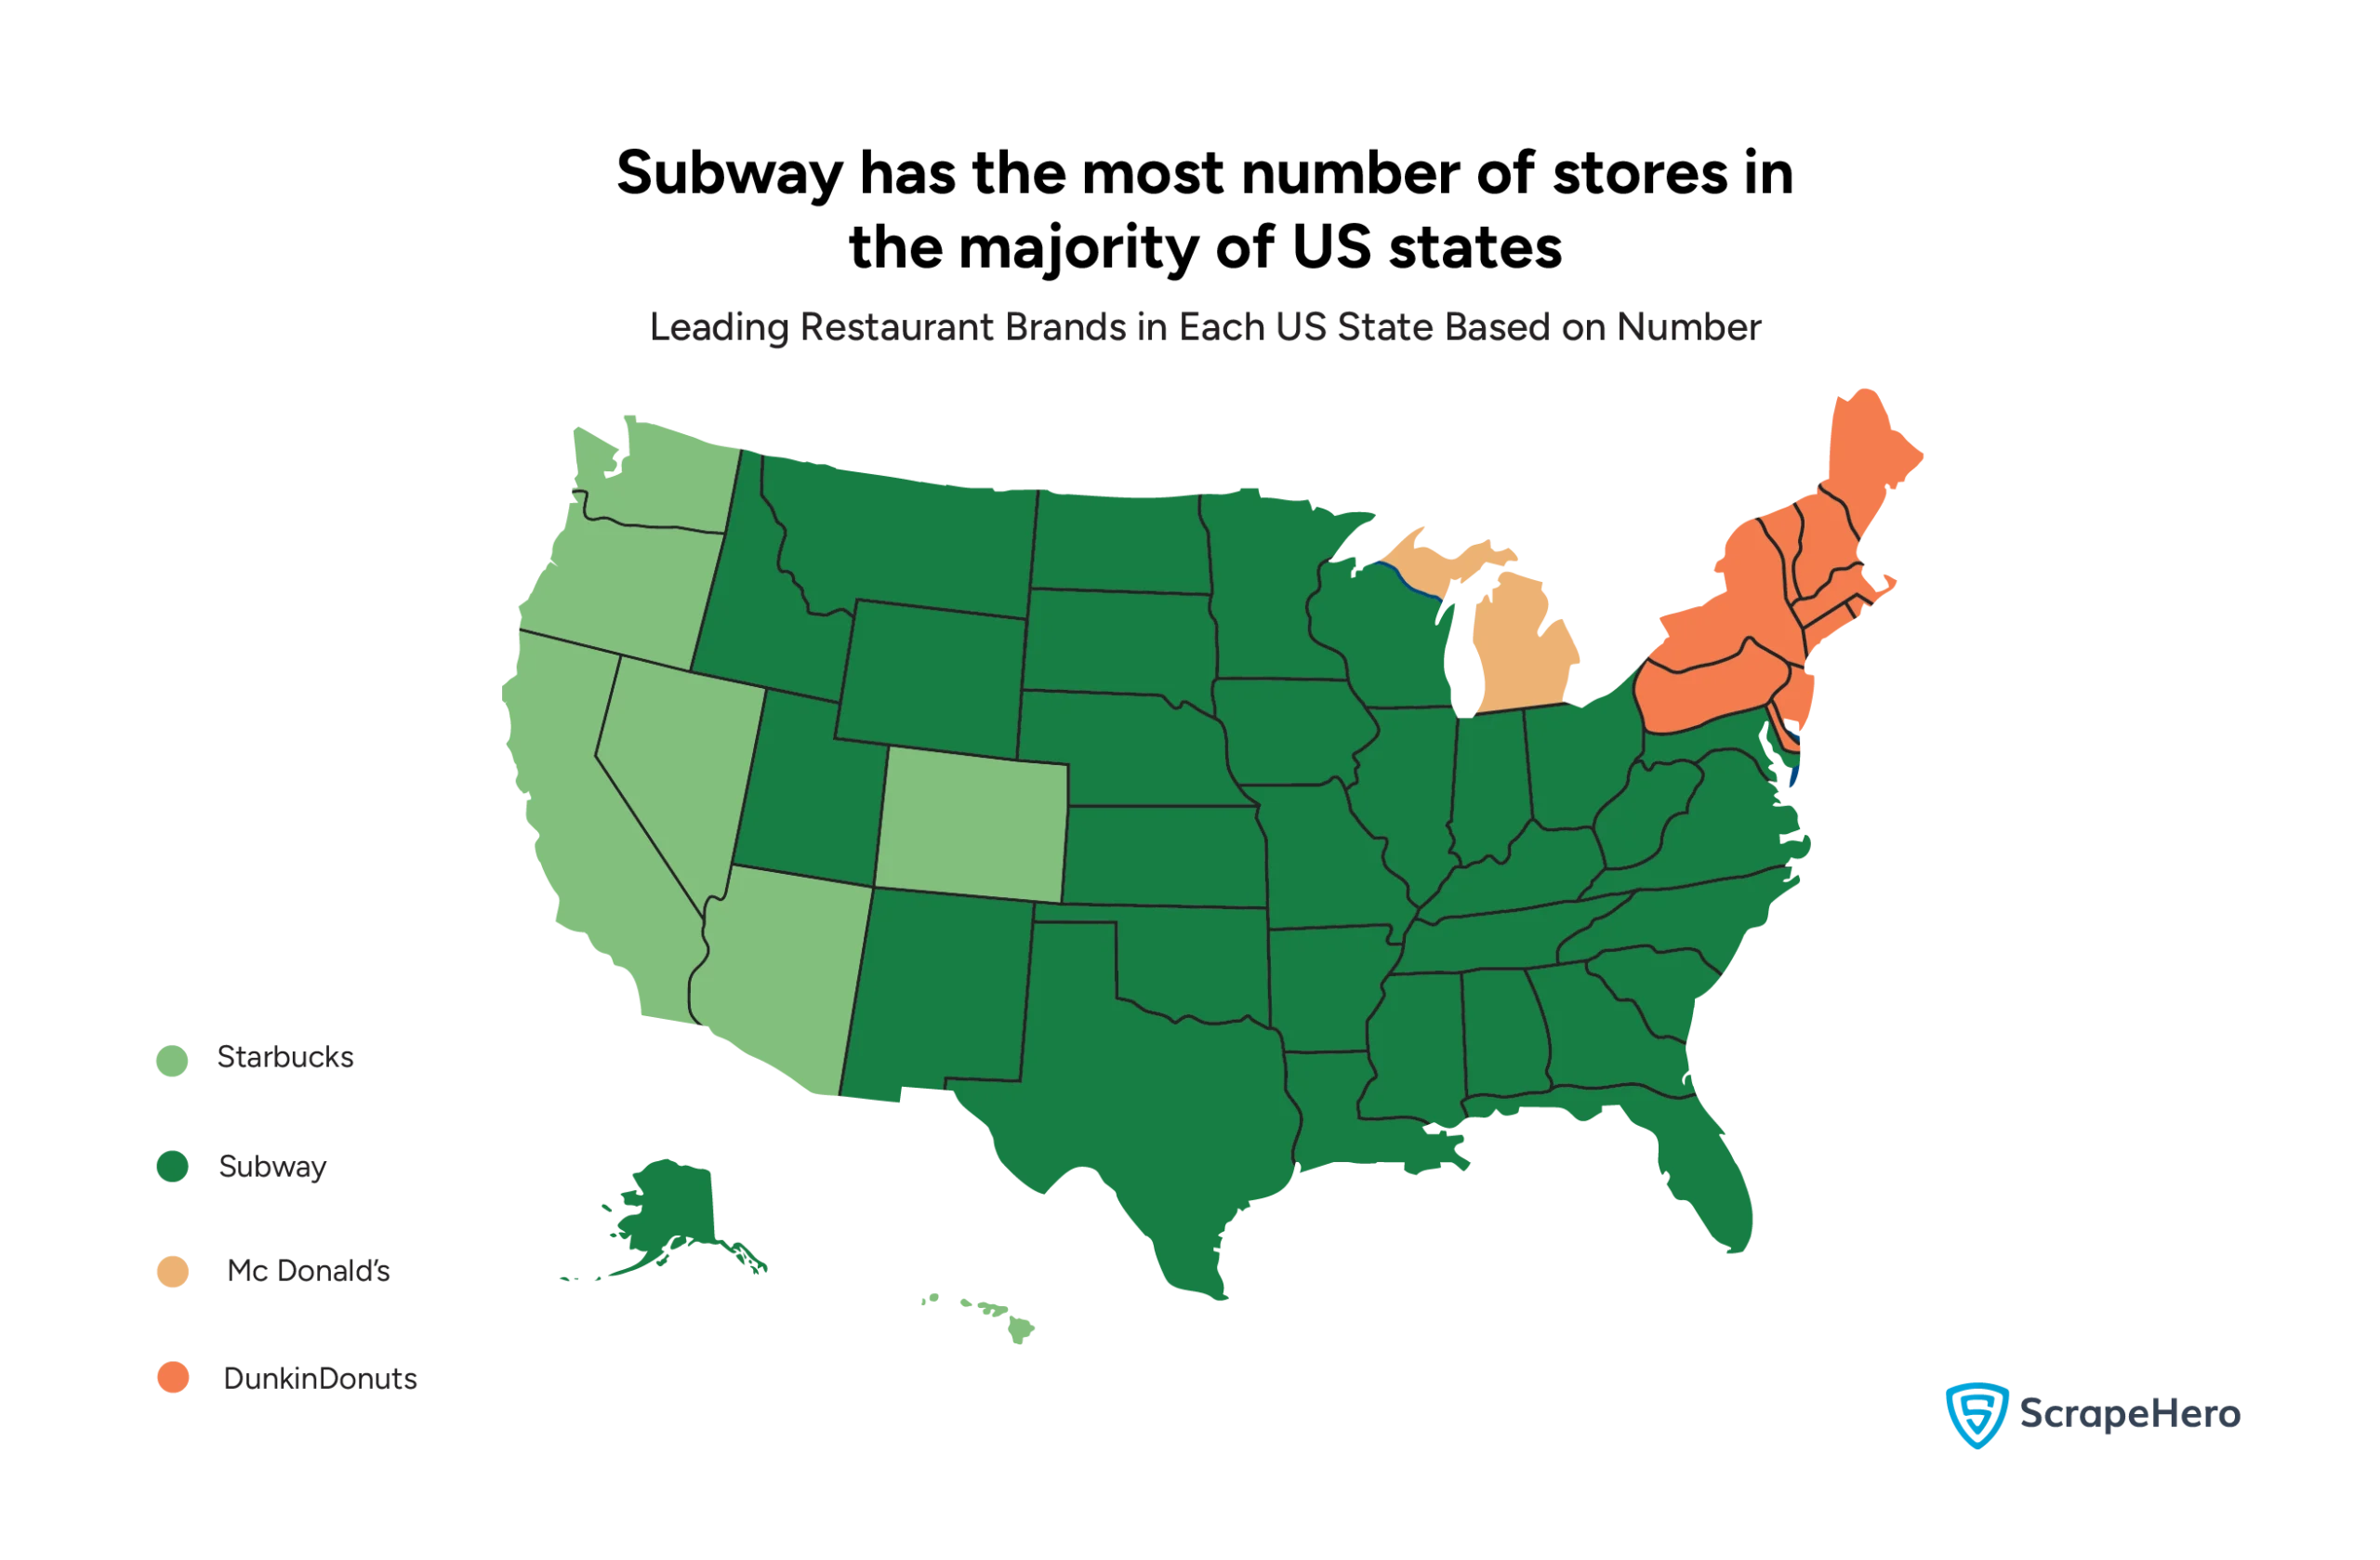
While Dunkin’ Donuts dominates in northeastern states, Starbucks has a notable presence in western states.
McDonald’s shows leadership in a few states.
How Do the Restaurant Chains in the US Cater to Diverse Markets?
Restaurants in Urban Areas
According to the data available on the US Census Bureau, New York, Los Angeles, Chicago, Houston, Phoenix, Philadelphia, San Antonio, San Diego, and Dallas are the most populated cities in the US.
We analyzed how the restaurant chains are distributed in these cities.
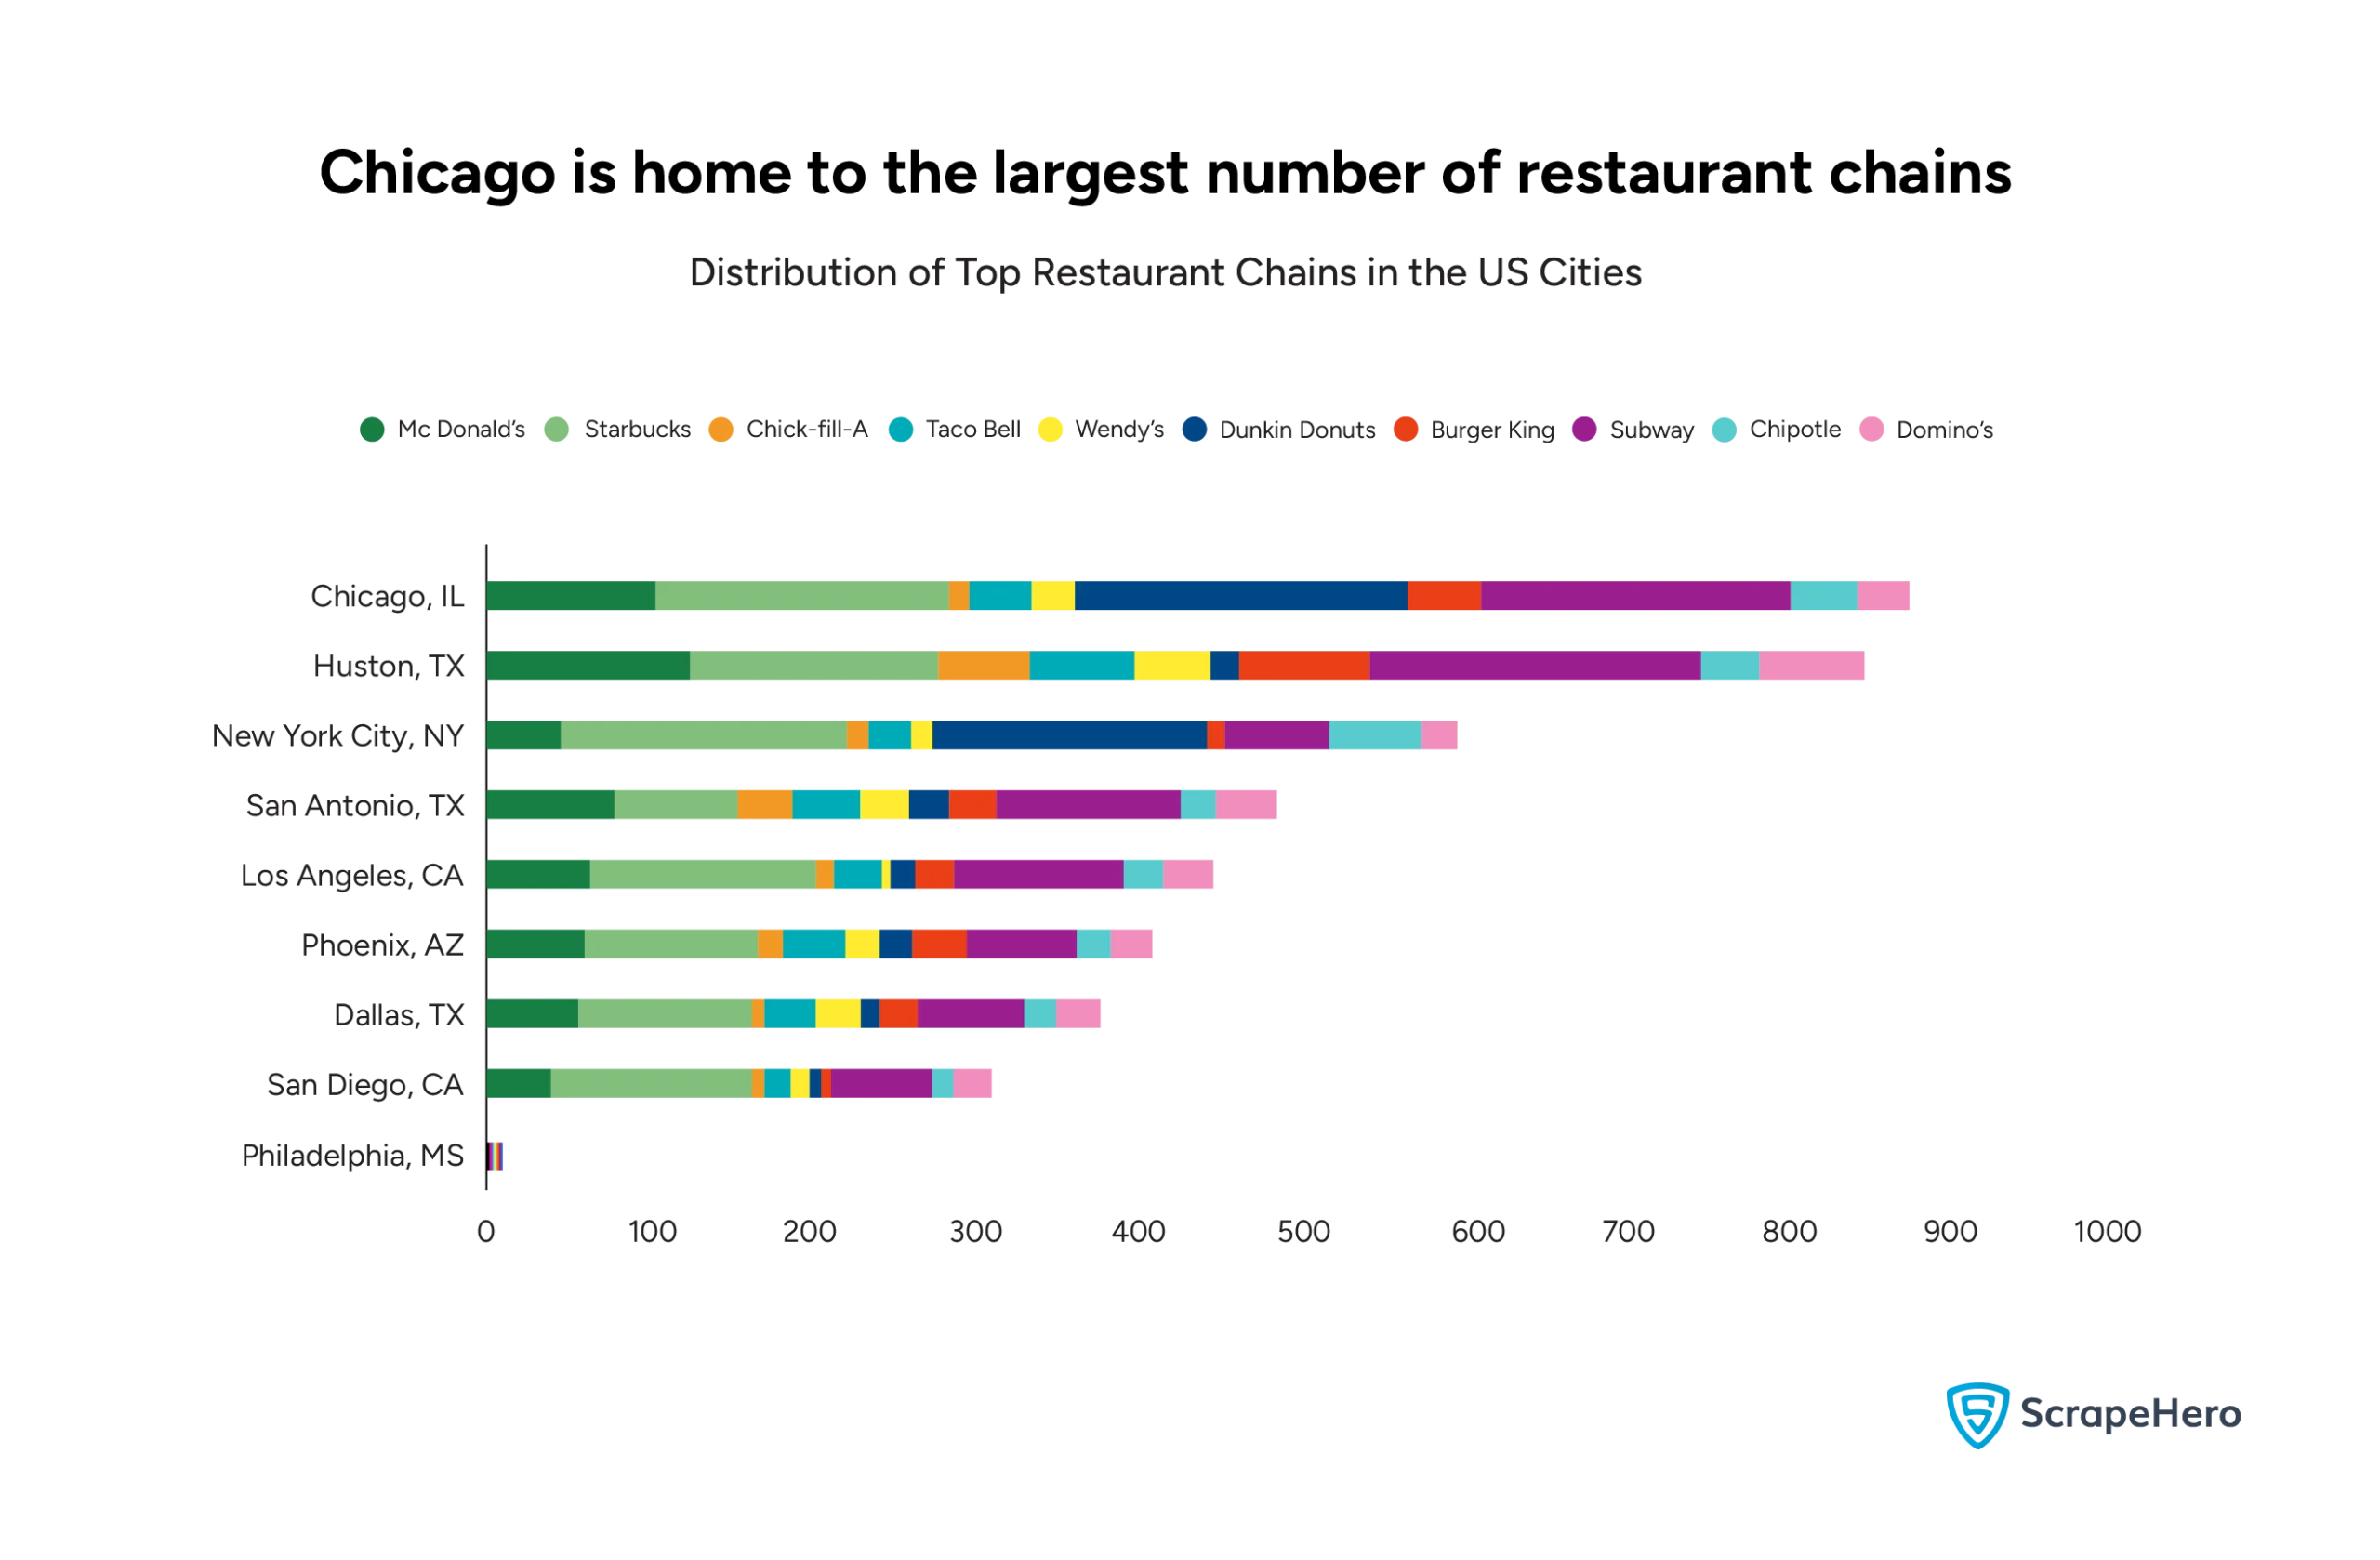
Subway consistently has a high number of stores across cities.
McDonald’s and Starbucks also maintain a significant presence in all cities.
A city-wise examination reveals that Chicago and Houston have the highest overall distribution of brands.
How Does State GDP Affect the Distribution of Restaurant Chains?
Let’s find out.
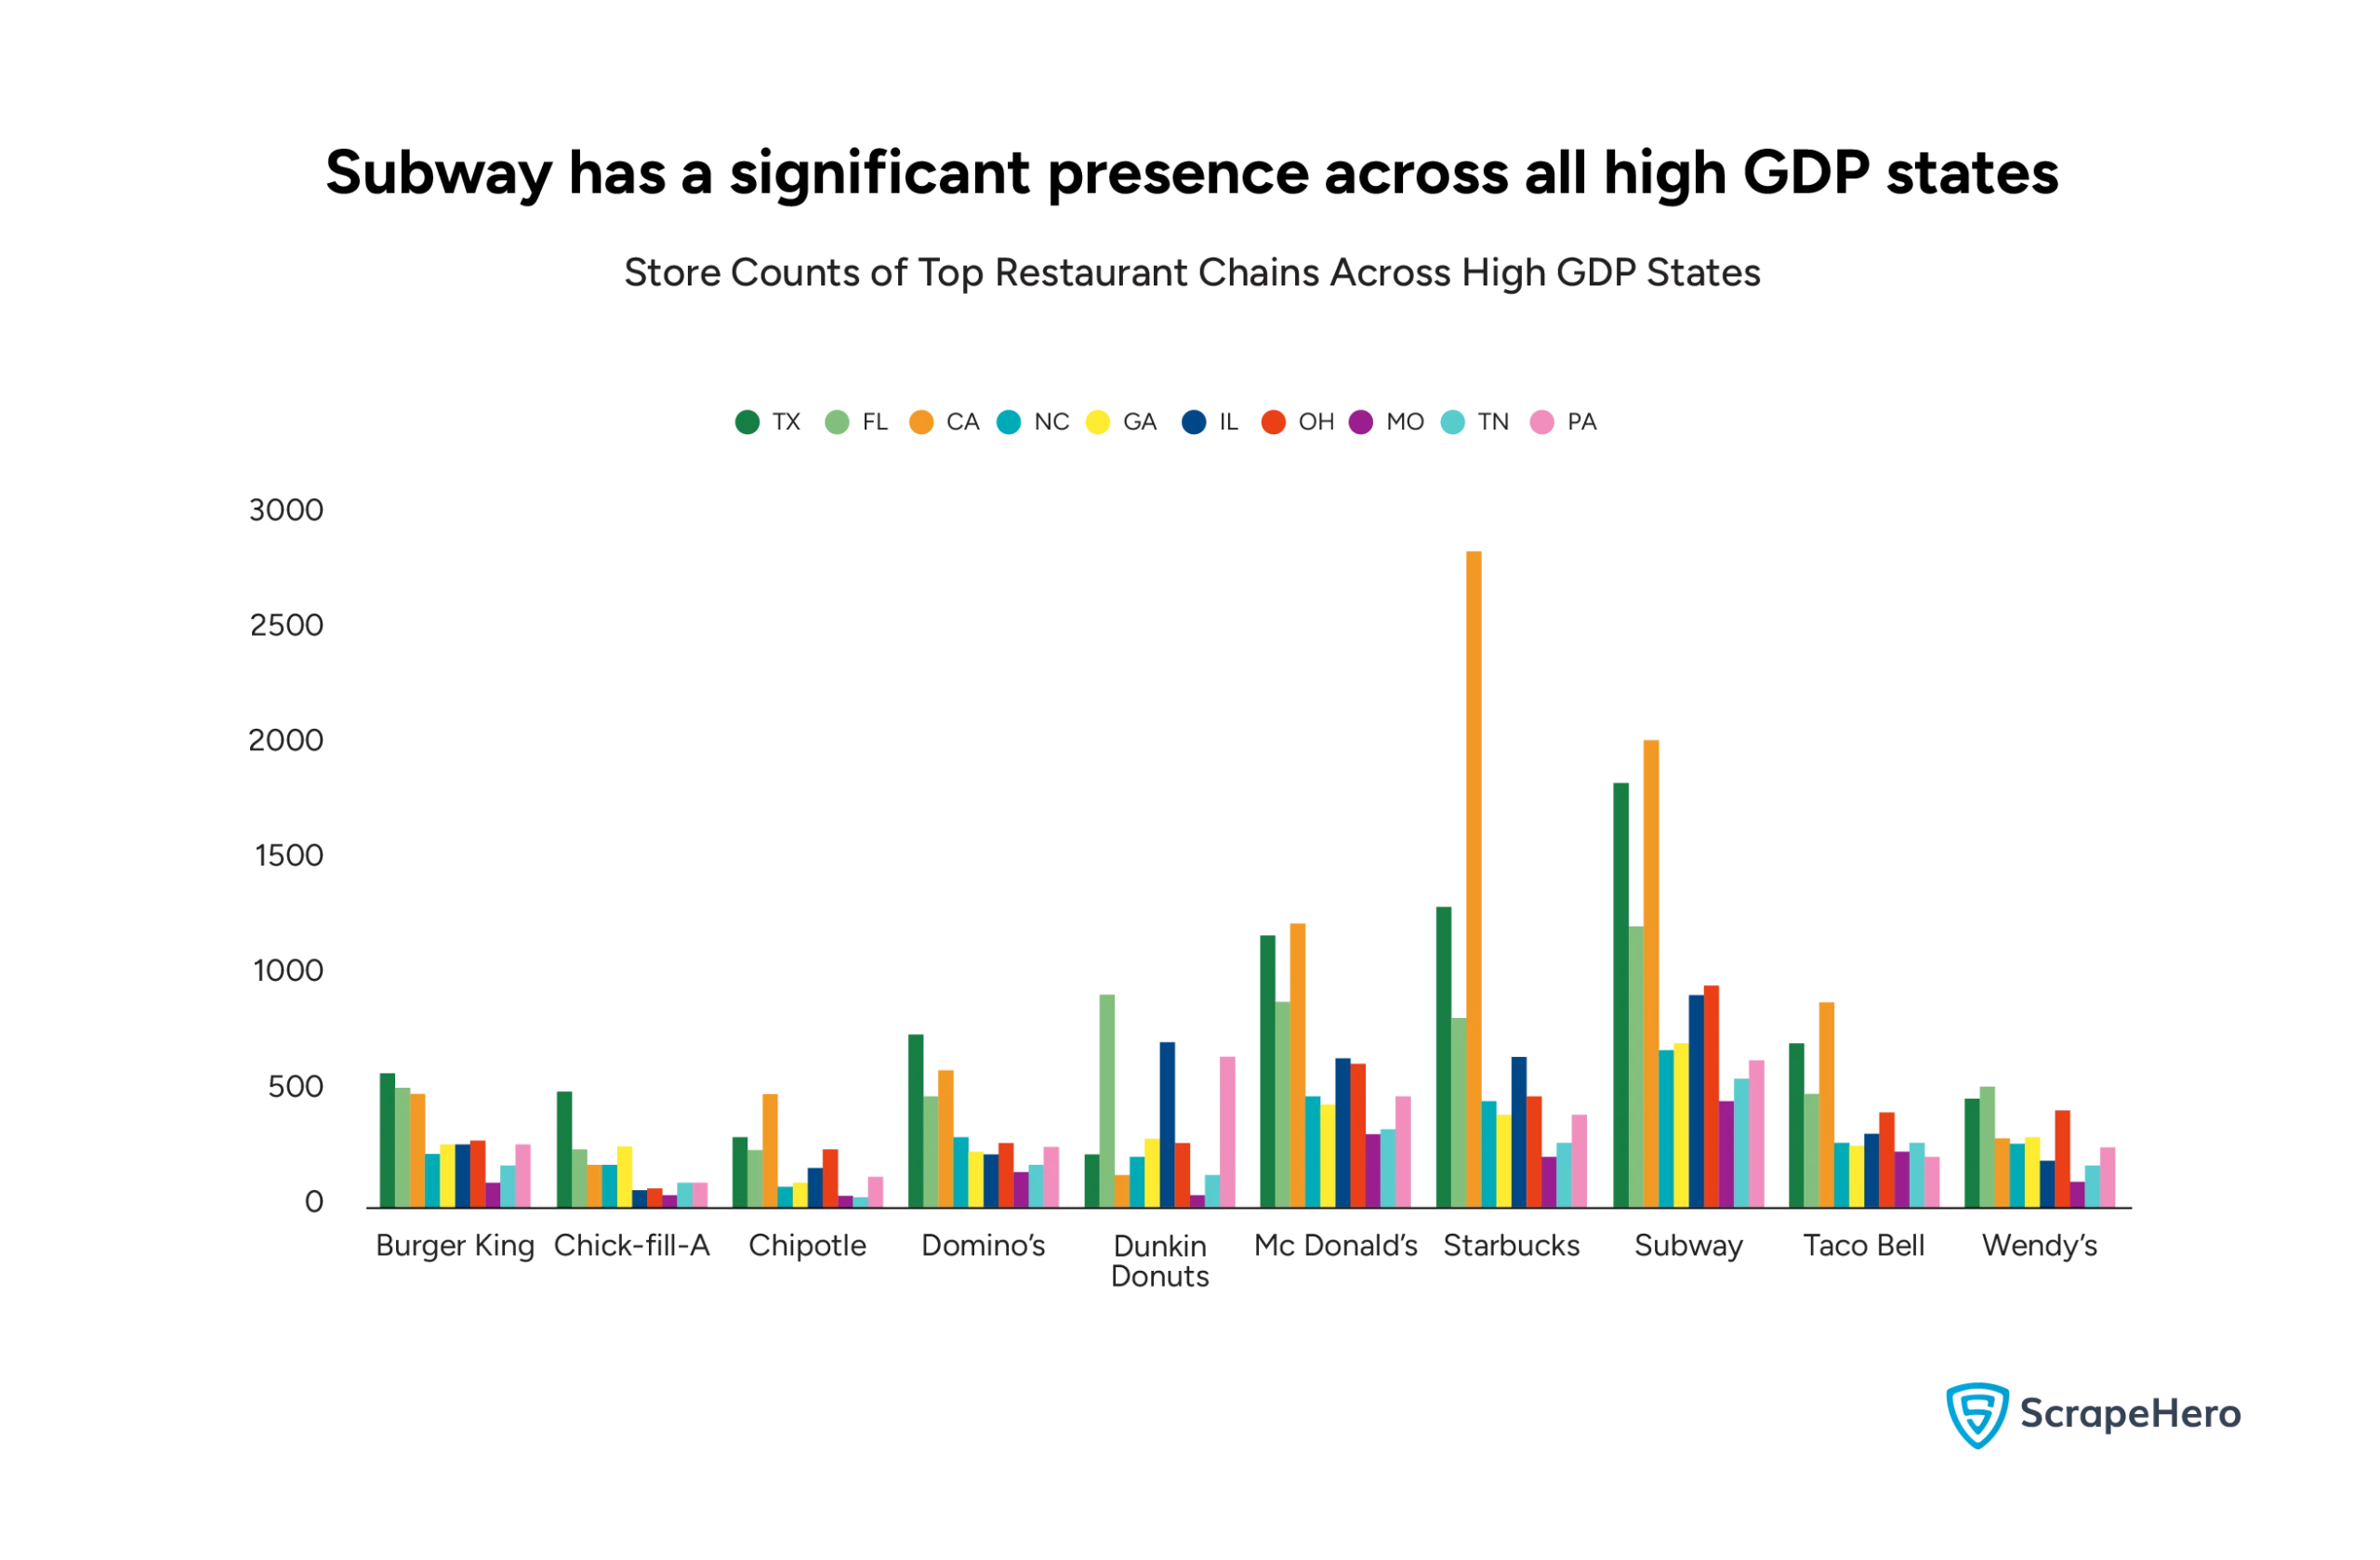
This bar chart shows the store count of major restaurant brands in US states with high GDP, including Texas (TX), California (CA), Florida (FL), and other top-performing states.
Given below is a bar chart that illustrates the store count of major restaurant chains in US states with low GDP, such as Vermont (VT), Alaska (AK), and Wyoming (WY).
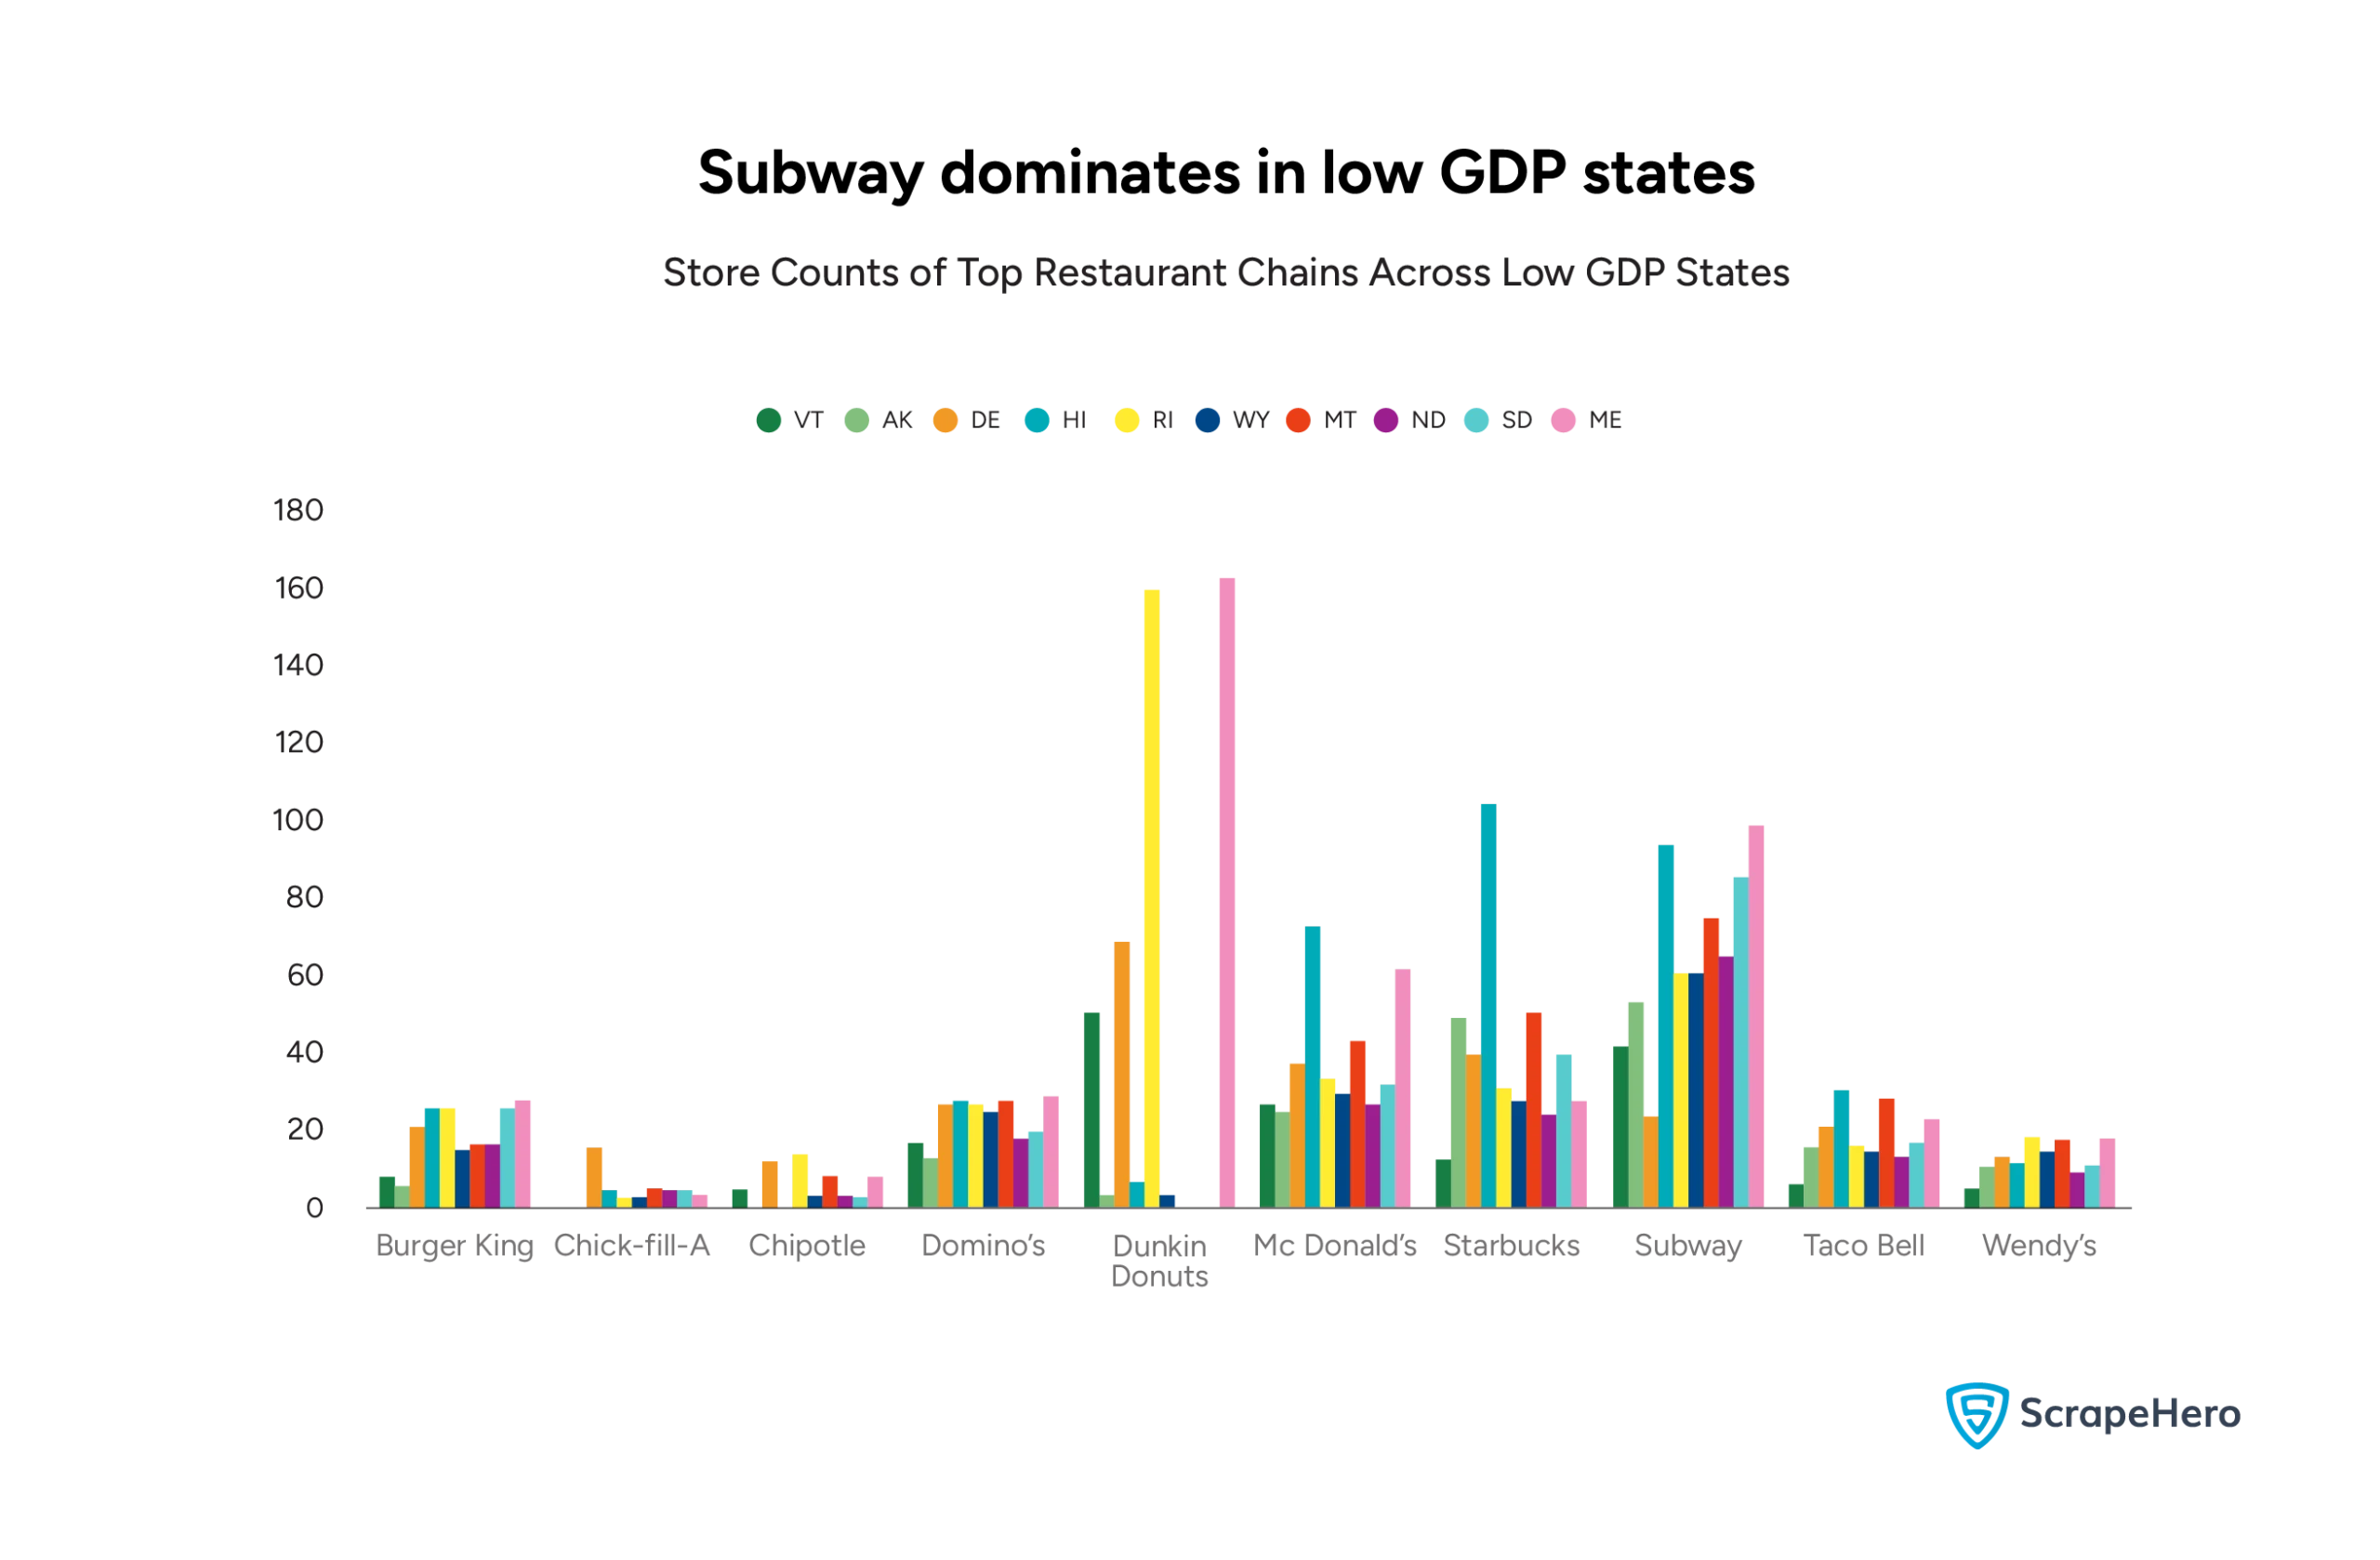
Comparing the two graphs of store counts in high-GDP states and low-GDP states, the following conclusions and inferences can be drawn:
McDonald’s and Subway dominate in both high- and low-GDP states. They are adaptable to both wealthy and less affluent markets.
However, in high-GDP states, their store counts are significantly higher.
Dunkin’ Donuts has a stronghold in the low-GDP states like Maine and Rhode Island. In contrast, its presence in high-GDP states is more limited geographically.
Starbucks thrives in high-GDP states like California and Texas. It still maintains a reasonable presence in low-GDP states but focuses less on these areas.
Chick-fil-A and Chipotle have relatively fewer stores in low-GDP states.
High-GDP states attract more premium brands like Starbucks, Chipotle, and Chick-fil-A, while brands with broader appeal (e.g., McDonald’s, Subway) dominate across the board.
Low-GDP states see fewer brands overall, with heavy reliance on affordable, franchise-heavy chains like McDonald’s and Subway.
NB: The information about the states with High GDP and Low GDP has been sourced from Intuit Turbotax.
Brand Popularity of the Leading Restaurant Chains in the US
The Google Search Interest Score is a metric from Google Trends that measures the relative frequency of searches for a specific term or topic over a selected time.
Here are the scores of the leading restaurant chains in the US over a month.
High search interest often indicates strong brand recognition and consumer curiosity.
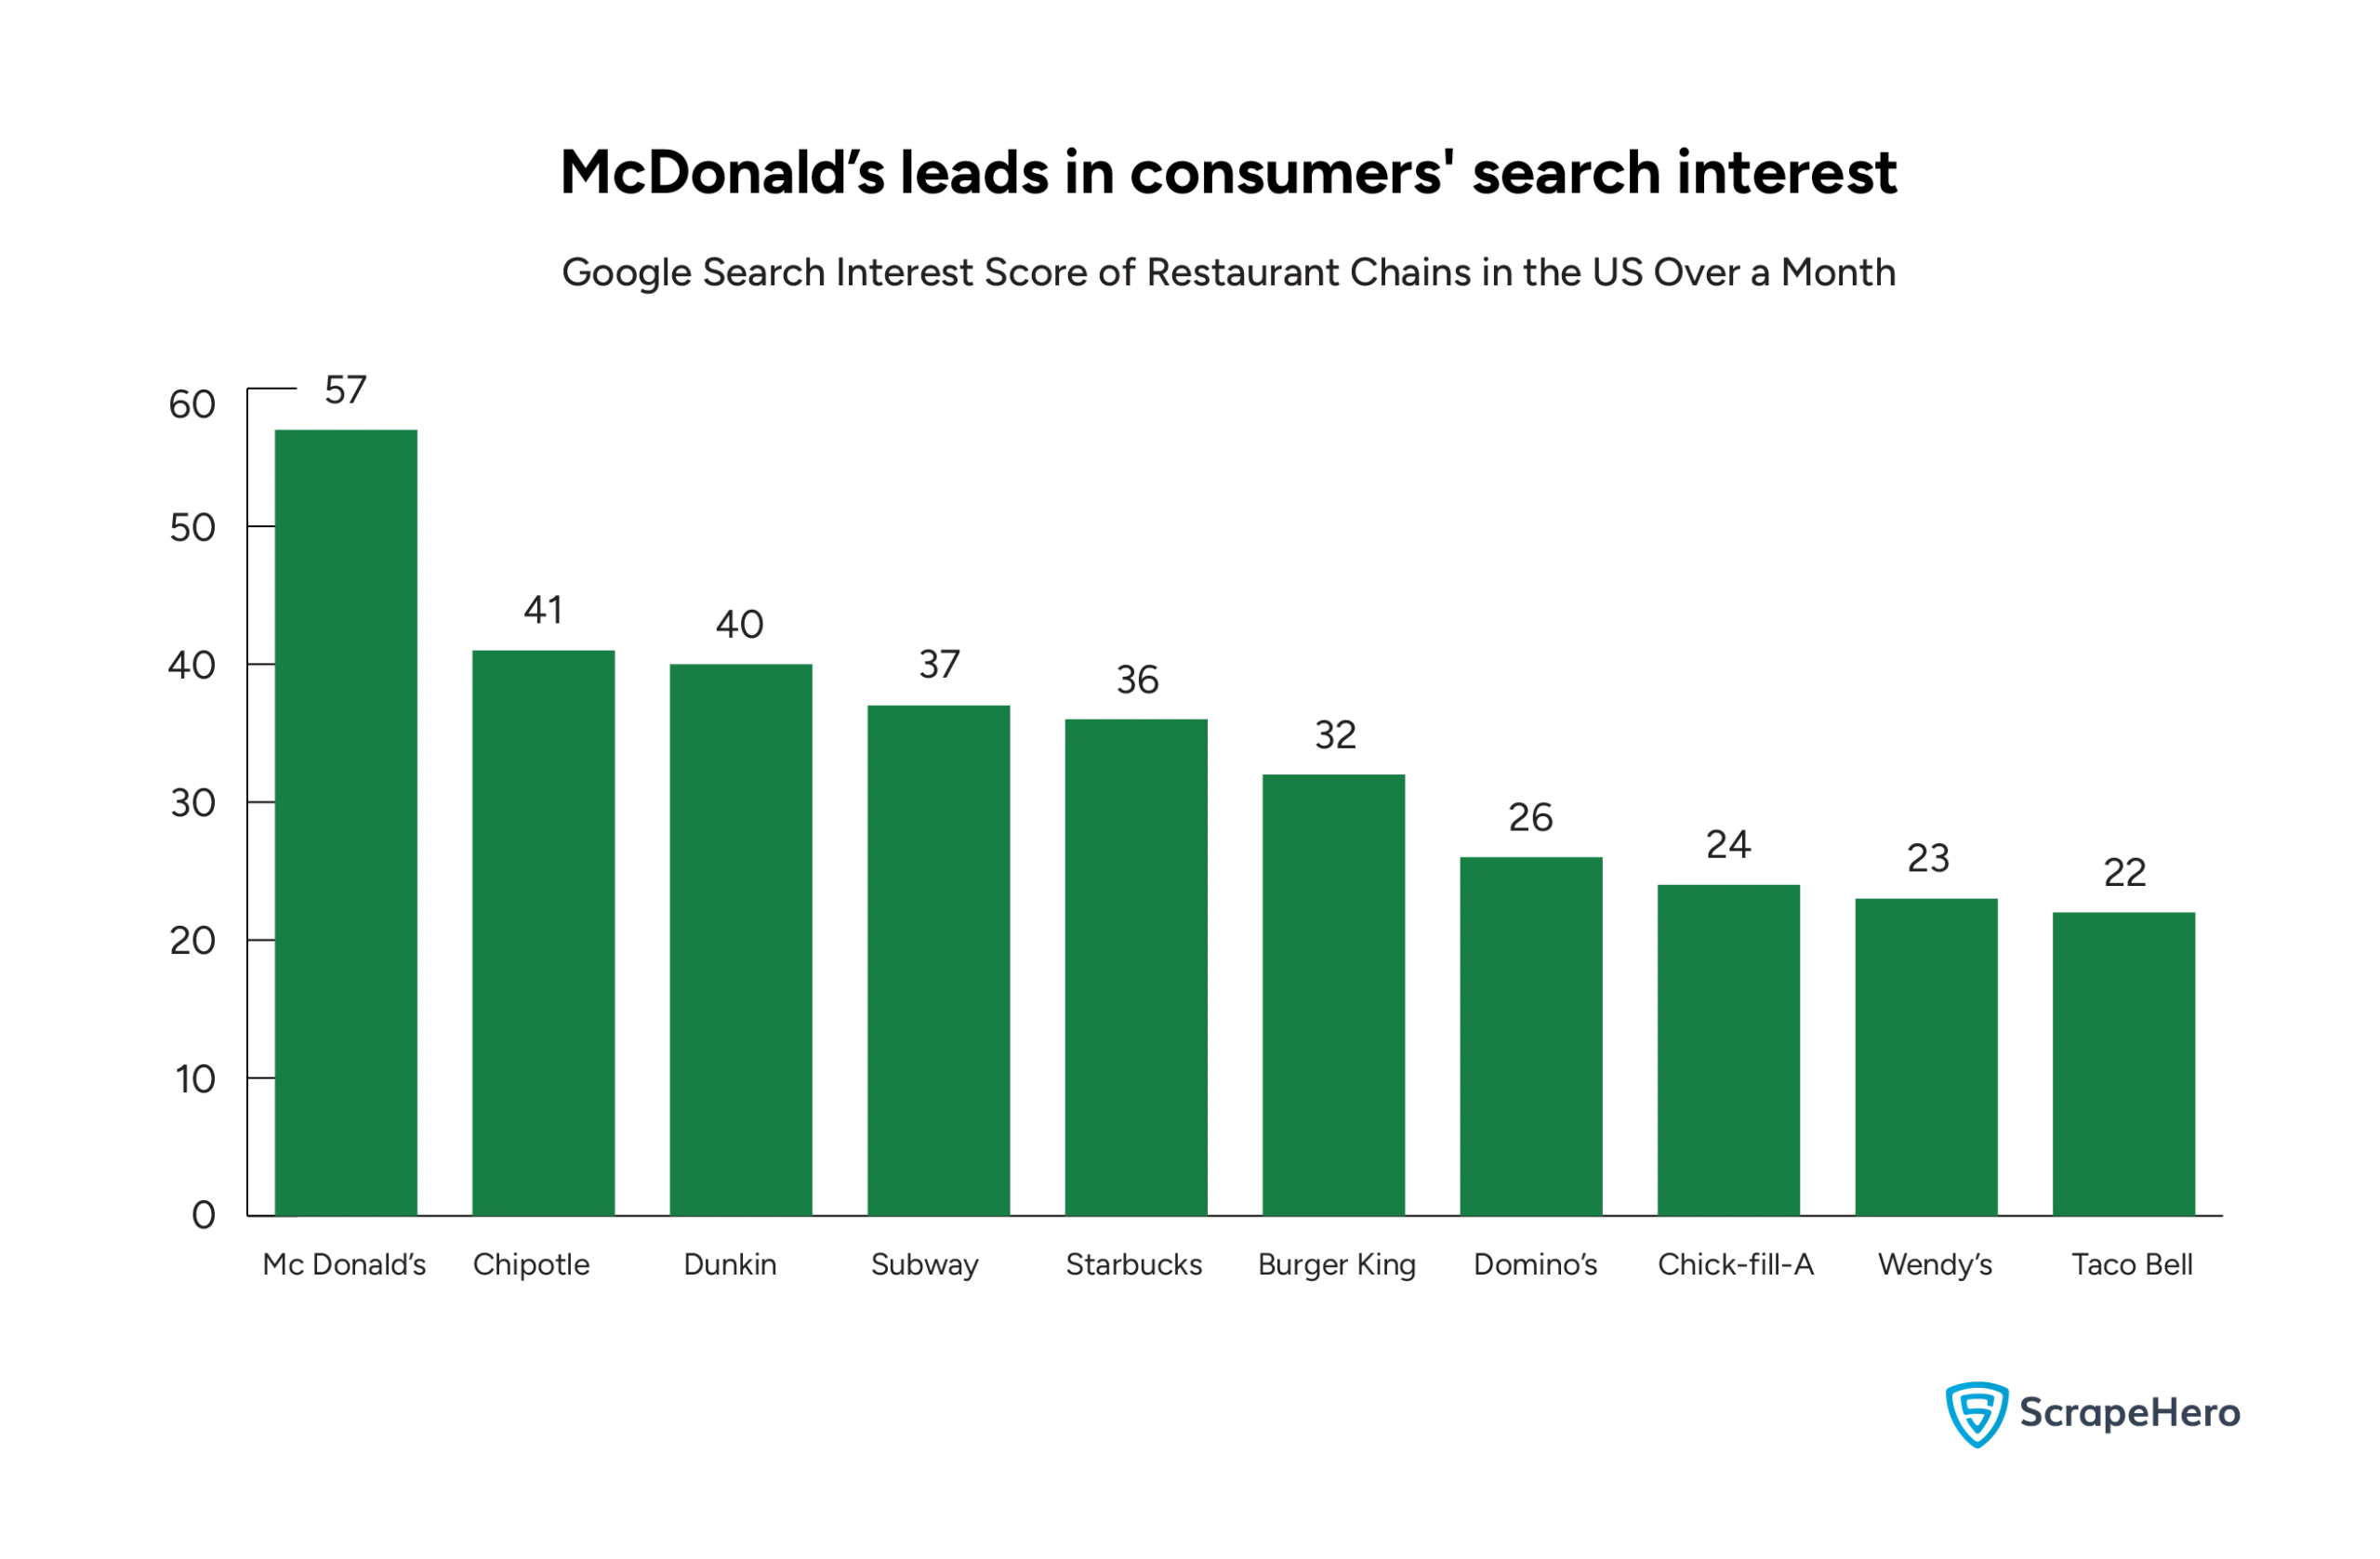
With a score of 57, McDonald’s is significantly ahead of all other brands, reflecting its consumer interest.
Chipotle (41) and Dunkin’ (40) are the next highest.
Subway (37) and Starbucks (36) also maintain strong online interest.
Brands like Wendy’s (23), Taco Bell (22), and Chick-fil-A (24) show lower search interest, which may reflect their more limited marketing reach or regional popularity compared to larger brands.
What Did the Analysis of US Restaurant Chains Reveal?
We found out that while McDonald’s leads in sales and search interest, Subway dominates in store count across the US, indicating that a large footprint doesn’t necessarily guarantee the highest revenue.
Chick-fil-A stands out for its high revenue despite having a limited number of stores.
Restaurant chains adapt their strategies based on location and economic factors. For instance, Subway has a significant presence in both high- and low-GDP states.
Urban areas show a concentration of multiple restaurant chains, with Chicago and Houston having the highest overall distribution.
Overall, the US restaurant chain landscape is diverse, with brands employing different strategies to cater to specific market segments.
Want to Do a Similar Analysis?
Our analysis of the US restaurant industry yielded many insights that were only possible with the data from the ScrapeHero Data Store.
While the Data Store is home to the POI data of millions of brands worldwide, if you are looking for customized, large-scale data analysis, we recommend partnering with a data partner.
A web scraping service like ScrapeHero will let you focus on your core business goals without having to worry about gathering accurate data ethically.
We are a fully managed enterprise-grade web scraping service.
Our experts have decades of experience in various industries. Talking to them is free and comes with no obligations to sign up with us. Contact ScrapeHero today, talk to one of our experts, and explore ways we can help your business.


