According to Statista, global car sales experienced a remarkable surge in 2023, reaching approximately 75.3 million vehicles, up from around 67.3 million units in 2022.
This impressive growth reinforces a vital truth: a car is much more than just a means of transportation.
For many, owning a vehicle goes beyond the simple act of commuting; it embodies pride and serves as a powerful statement of personal identity.
The choice of car reflects individual values, aspirations, and lifestyle, making it an integral part of who we are.
To understand the trends in the online car market, we conducted an extensive car data analysis over a month by gathering data from eight key websites: supercarros.com, villavictoriaauto.com, pitaautopr.com, tonitodoutlet.com, jacars.net, pin.tt, autobahamas.com, and autobarbados.com.
This analysis will help you understand the current landscape of car ownership and consumer preferences and can be your guide in navigating the current automotive market.
Are you looking for data but want to avoid the hassle of gathering it? Let ScrapeHero web scraping service handle the heavy lifting for you!
With ScrapeHero Cloud, you can download data in just two clicks!Don’t want to code? ScrapeHero Cloud is exactly what you need.
An Overview of Our Car Data Analysis
Number of Cars Listed
Among the platforms we analyzed, jacars.net has the most number of cars listed with 5,996 car listings, significantly higher than any other platform.
pin.tt follows as the second largest, with 3,959 listings.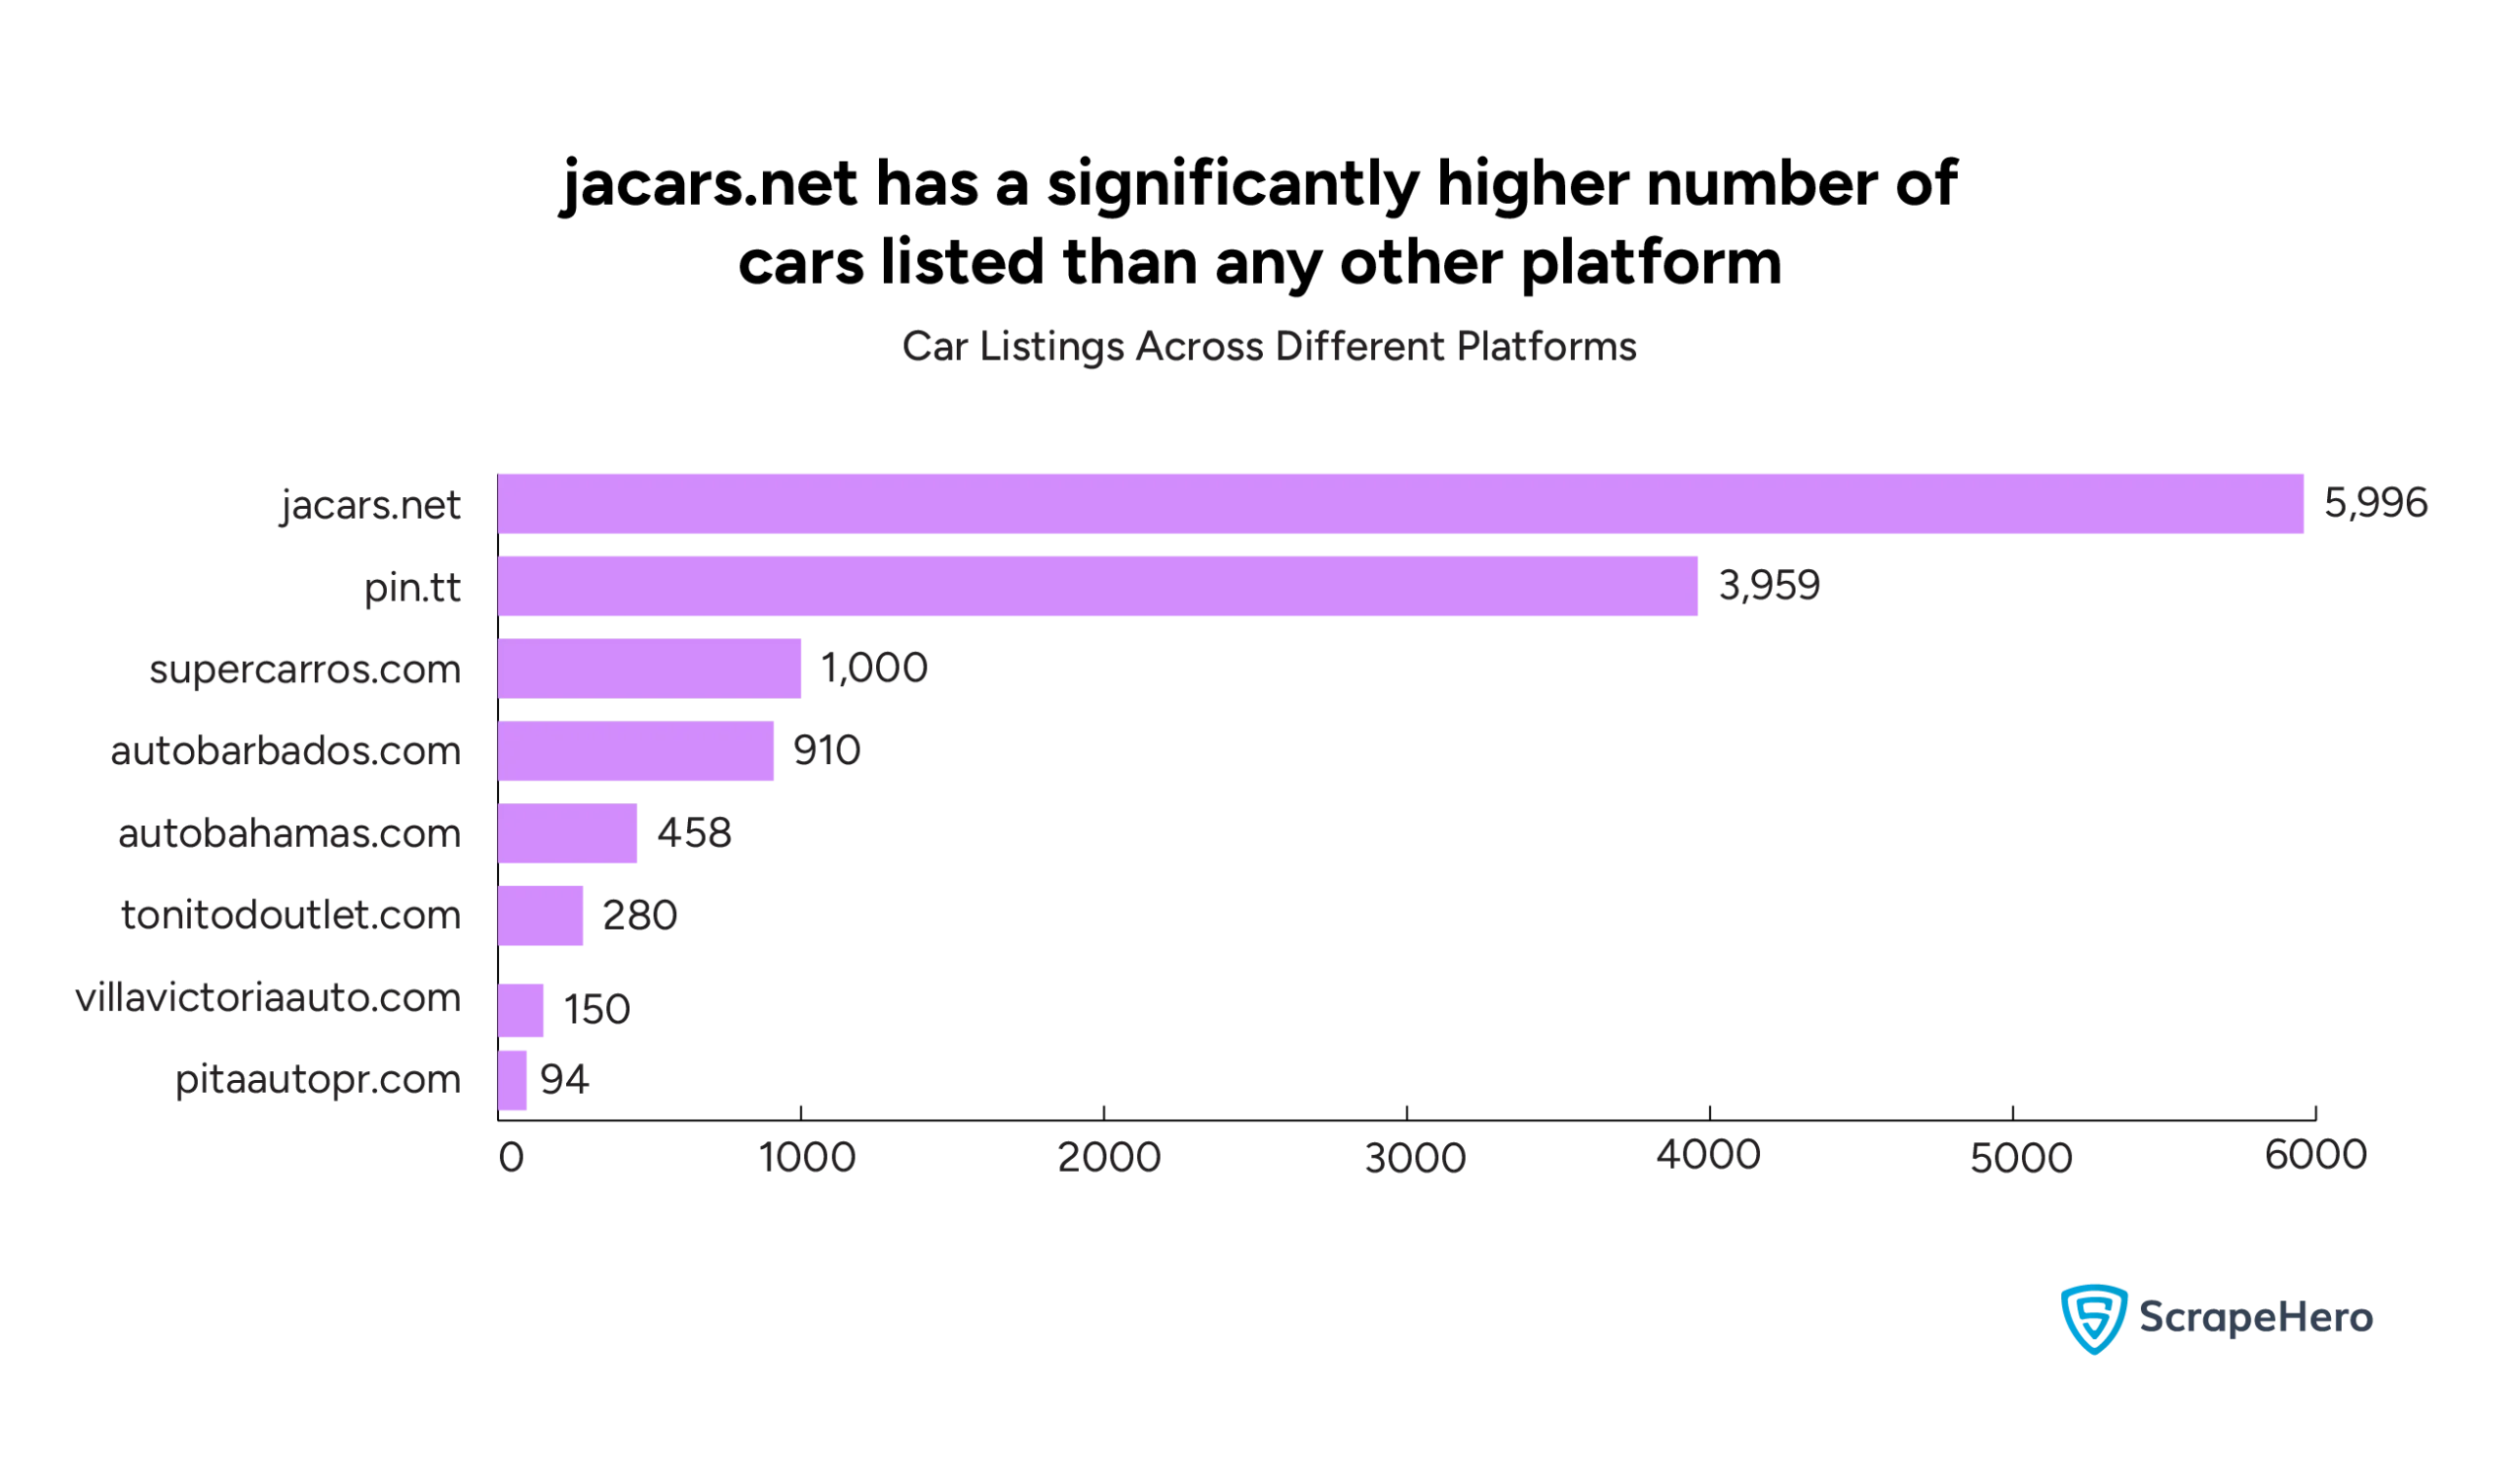
We then compare the top listings with the average prices of the cars on each platform.
Price Range of Cars Listed
jacars.net and pin.tt have the highest number of car listings but relatively lower average prices. jacars.net’s average price is around $18,807, and pin.tt’s is $13,166.
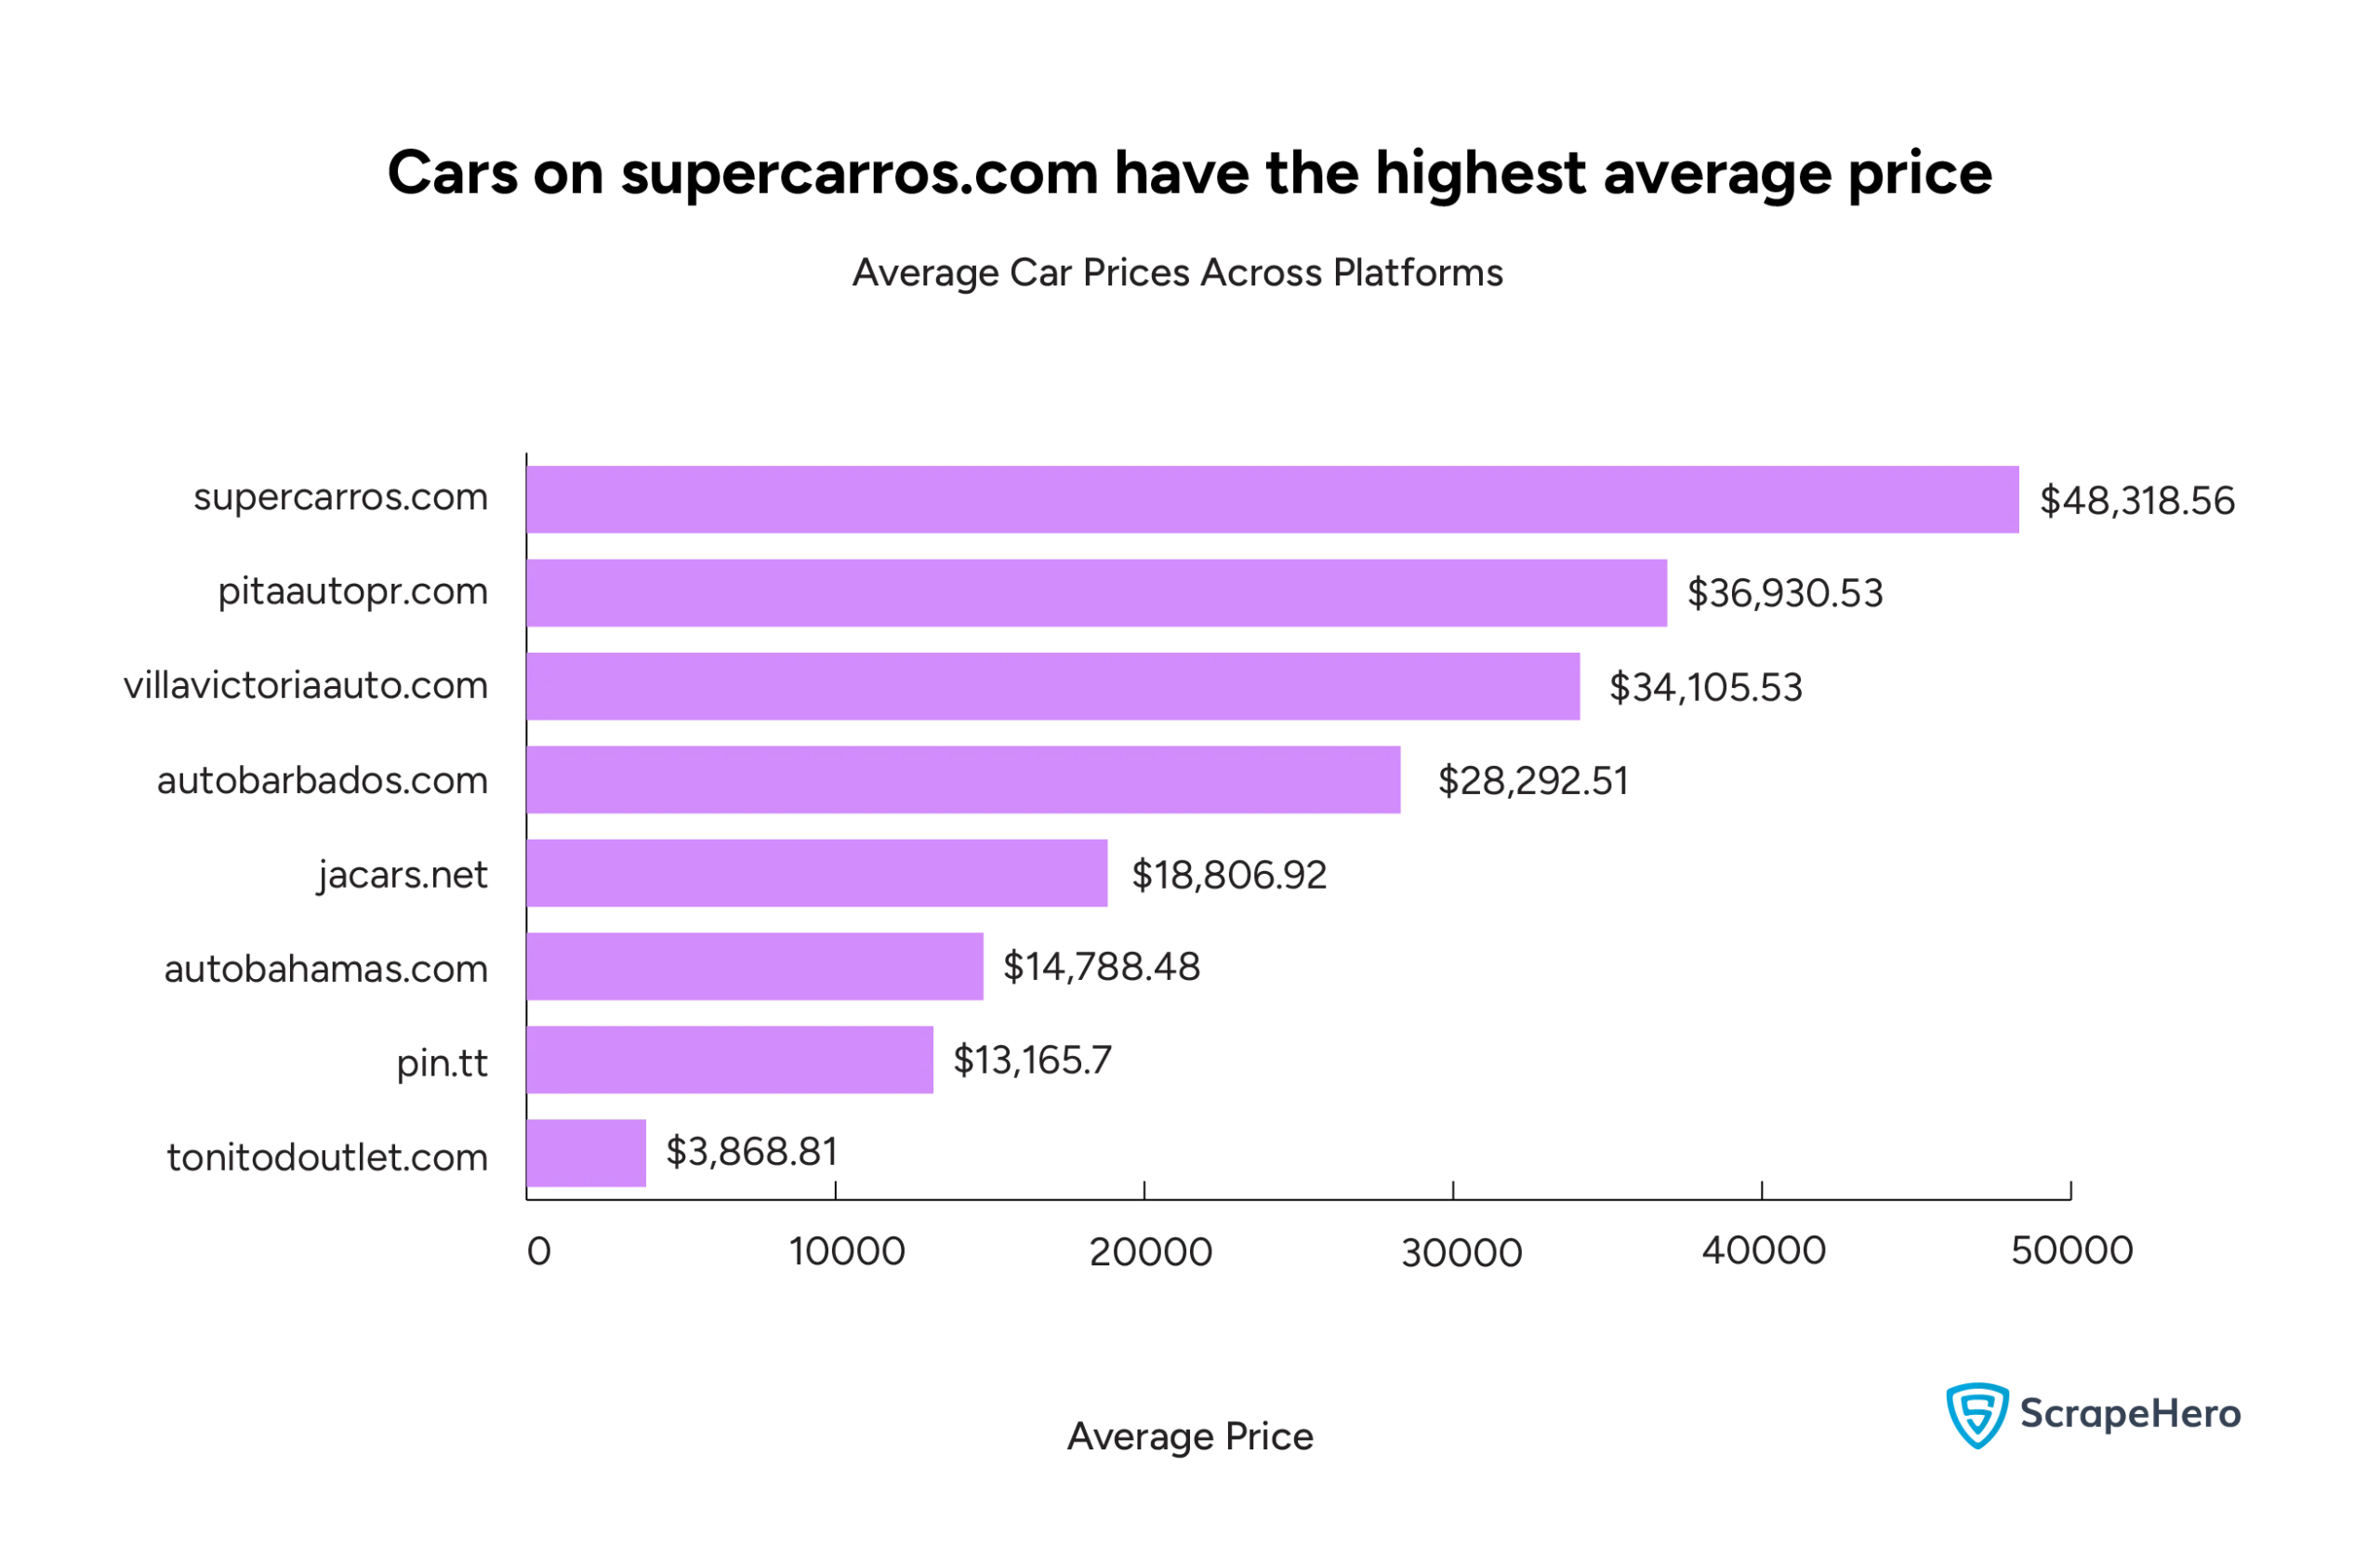
supercarros.com has fewer listings (1,000) but the highest average car price at $48,318.56.
villavictoriaauto.com and pitaautopr.com feature high average prices ($34,105.53 and $36,930.53, respectively) but have relatively low listings.
Thus, websites with the most listings don’t necessarily have the highest average prices. Let us now explore the factors that influence car prices.
Condition of Cars Listed
Platforms used for car data analysis cater primarily to the used car market, with some focus on imported and new cars to meet niche demands.
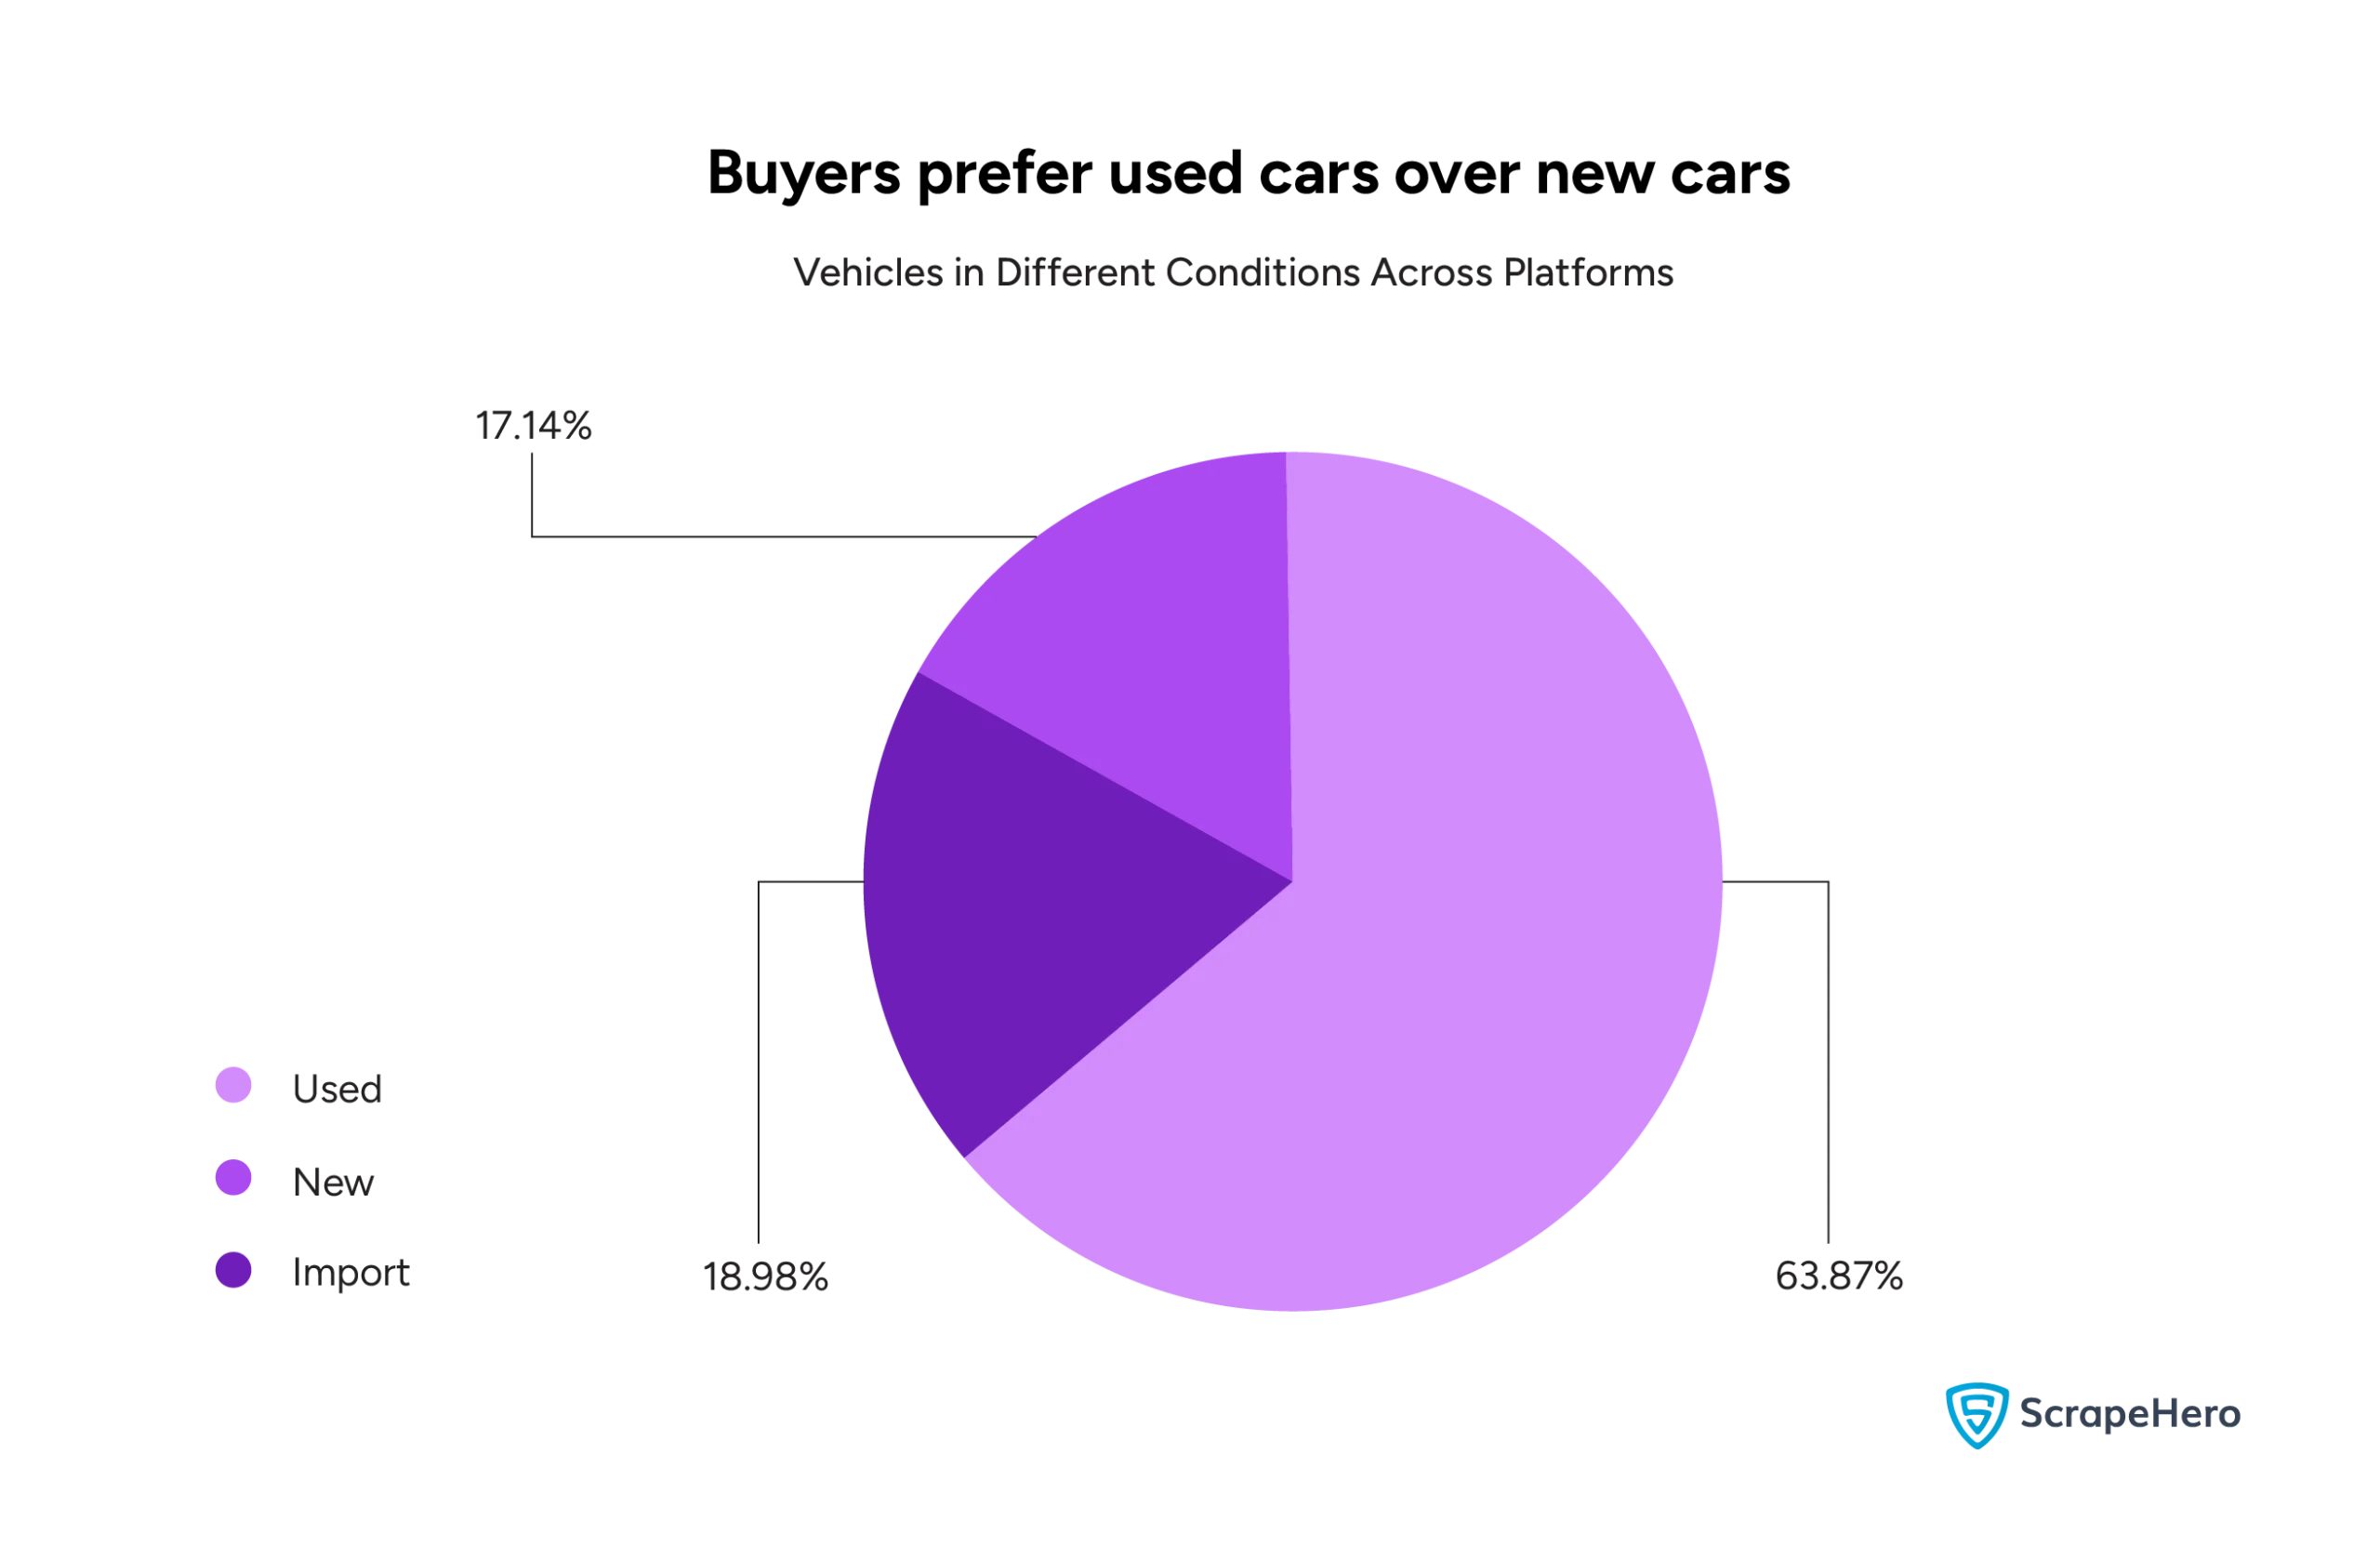
63.87% of the vehicles listed are used. This suggests a strong preference or demand for used cars, possibly due to affordability compared to new or imported options.
18.98% of the listings are imported vehicles. This segment is significant but smaller than used vehicles.
The presence of imported vehicles could imply that there’s a market for unique or foreign models that aren’t manufactured domestically.
Only 17.14% of the listings are new vehicles, making it the smallest segment in the market.
This limited percentage of new vehicles might indicate higher prices associated with new cars, making them less accessible to the majority.
Insights on Buyer Preferences:
- The high percentage of used vehicles suggests a cost-sensitive market where buyers prefer pre-owned options, likely for budgetary reasons.
- The relatively small share of new vehicles may also indicate that most consumers prioritize value over the latest models or advanced features typically associated with new cars.
- Imported cars are appealing to consumers who might be looking for specific international brands or unique models that are not widely available locally.
Now, onto the specifics.
Most Popular Car Type
Our car data analysis reveals that SUVs are the most popular or in-demand car type. They lead by a substantial margin, with 3,487 listings on all the platforms.
Sedans are the second most listed type, with 2,025 listings, followed by Hatchbacks.
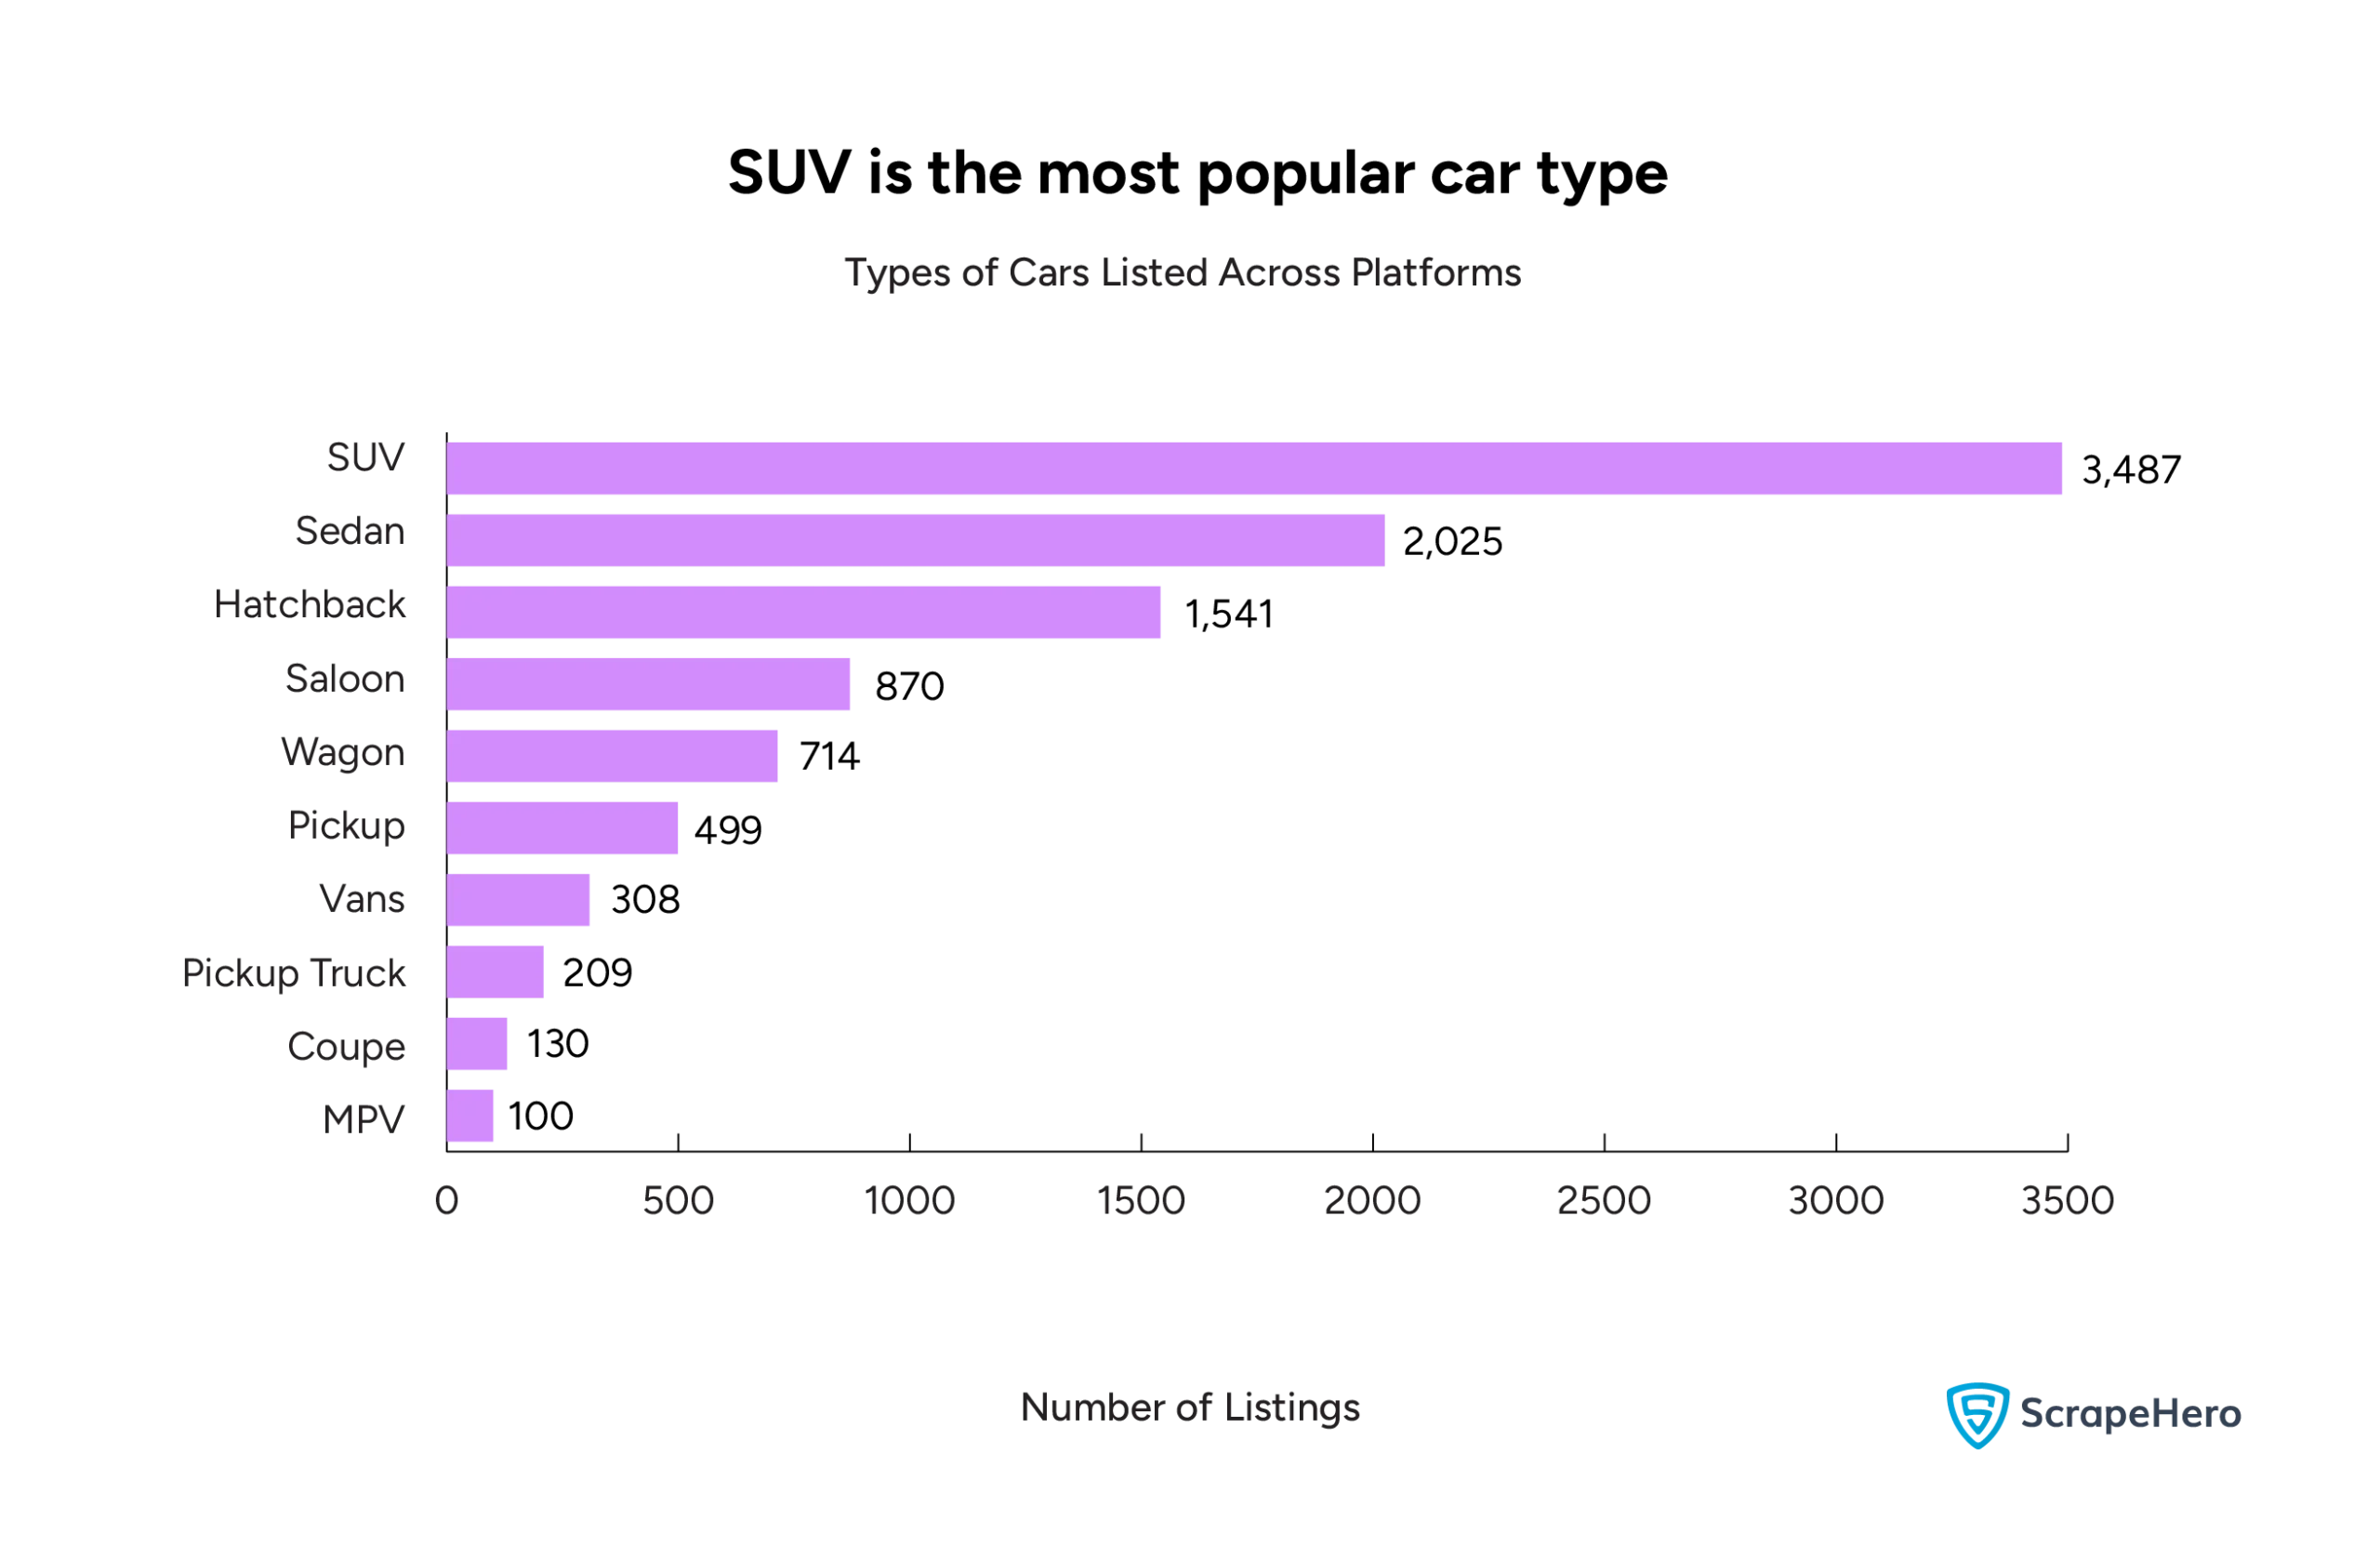
SUVs and Sedans alone make up a large portion of the market, showing that these types are likely the most in demand among customers.
There is a significant drop in listings from the top three types (SUVs, Sedans, Hatchbacks) to other categories, especially after the Saloon and Wagon types.
We then analyzed the price of SUVs across different platforms.
It revealed a clear segmentation in SUV pricing across platforms, with some platforms focusing on high-end, luxury SUVs and others providing budget-friendly options.
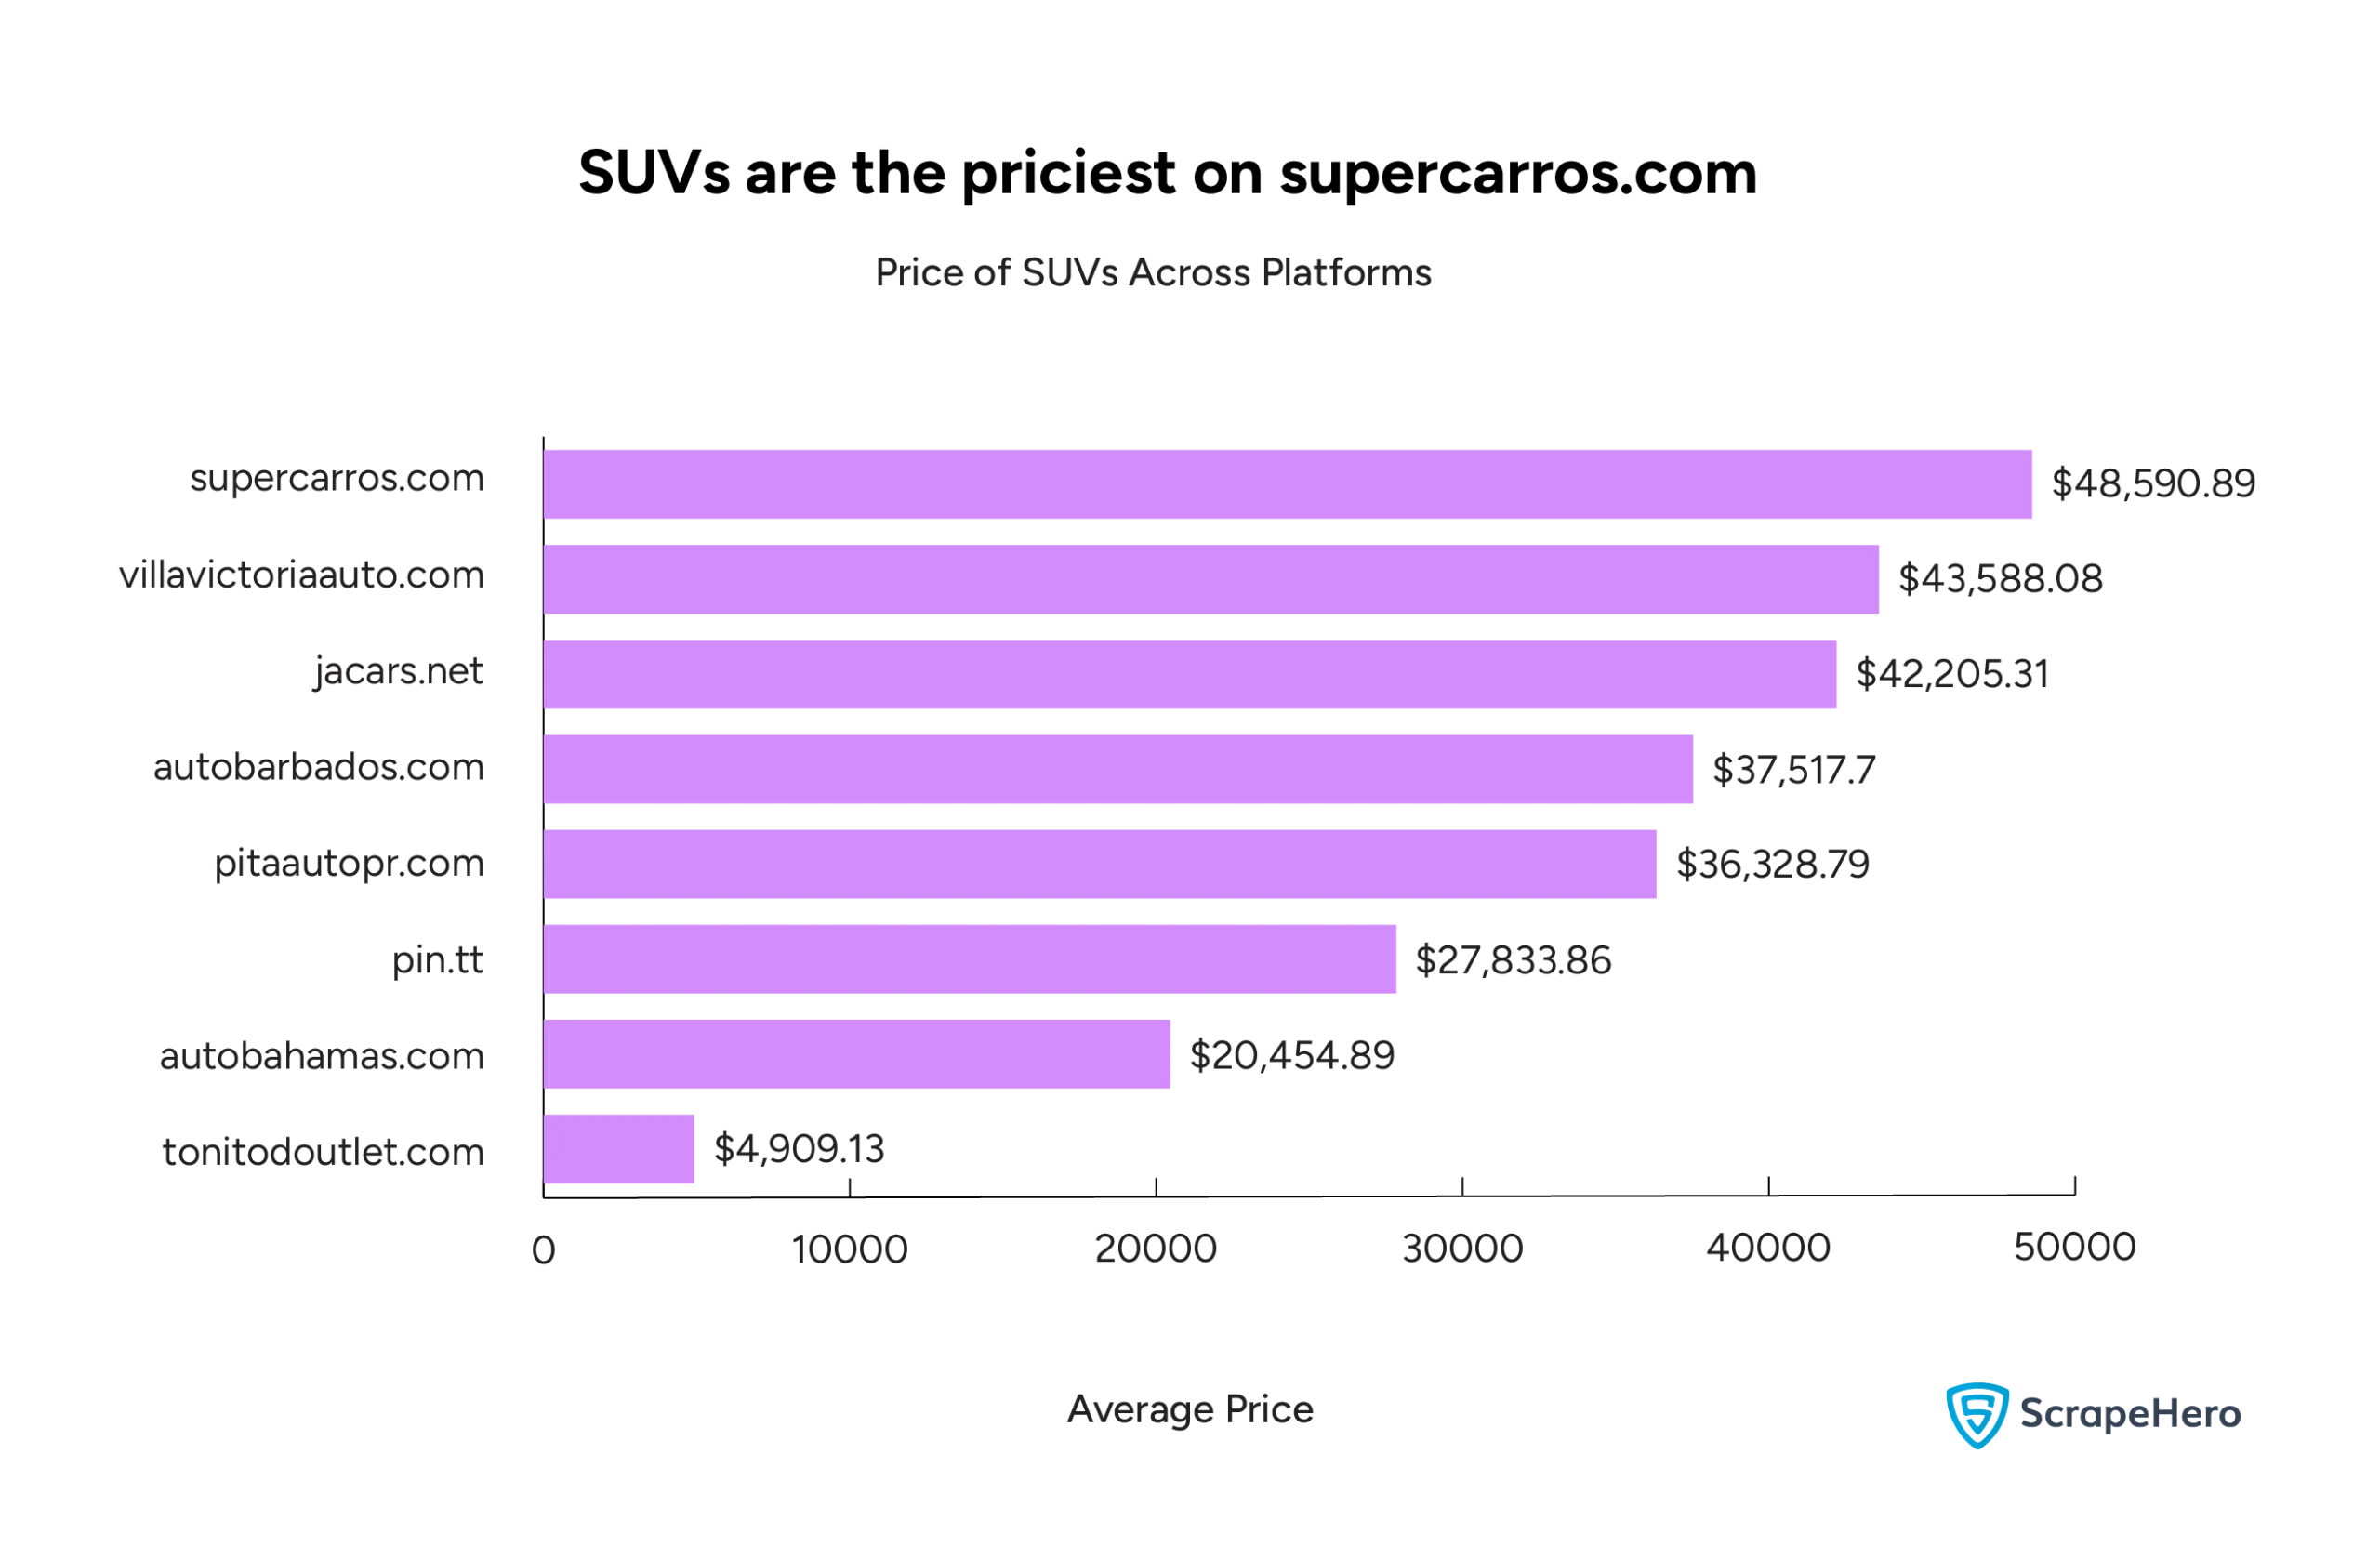
supercarros.com has the highest average price for SUVs at $48,590.89.
villavictoriaauto.com and jacars.net follow closely, with average SUV prices of $43,588.08 and $42,205.31, respectively.
These platforms with the highest average SUV prices are likely positioned as premium platforms, possibly listing newer, luxury, or high-performance SUVs.
Websites like tonitodoutlet.com clearly focus on budget SUVs, positioning itself as an accessible platform for cost-conscious buyers.
Highest Priced Cars
Jeeps have the highest average price, at $60,650. Minivans follow, with a relatively high average price of $53,393.33.
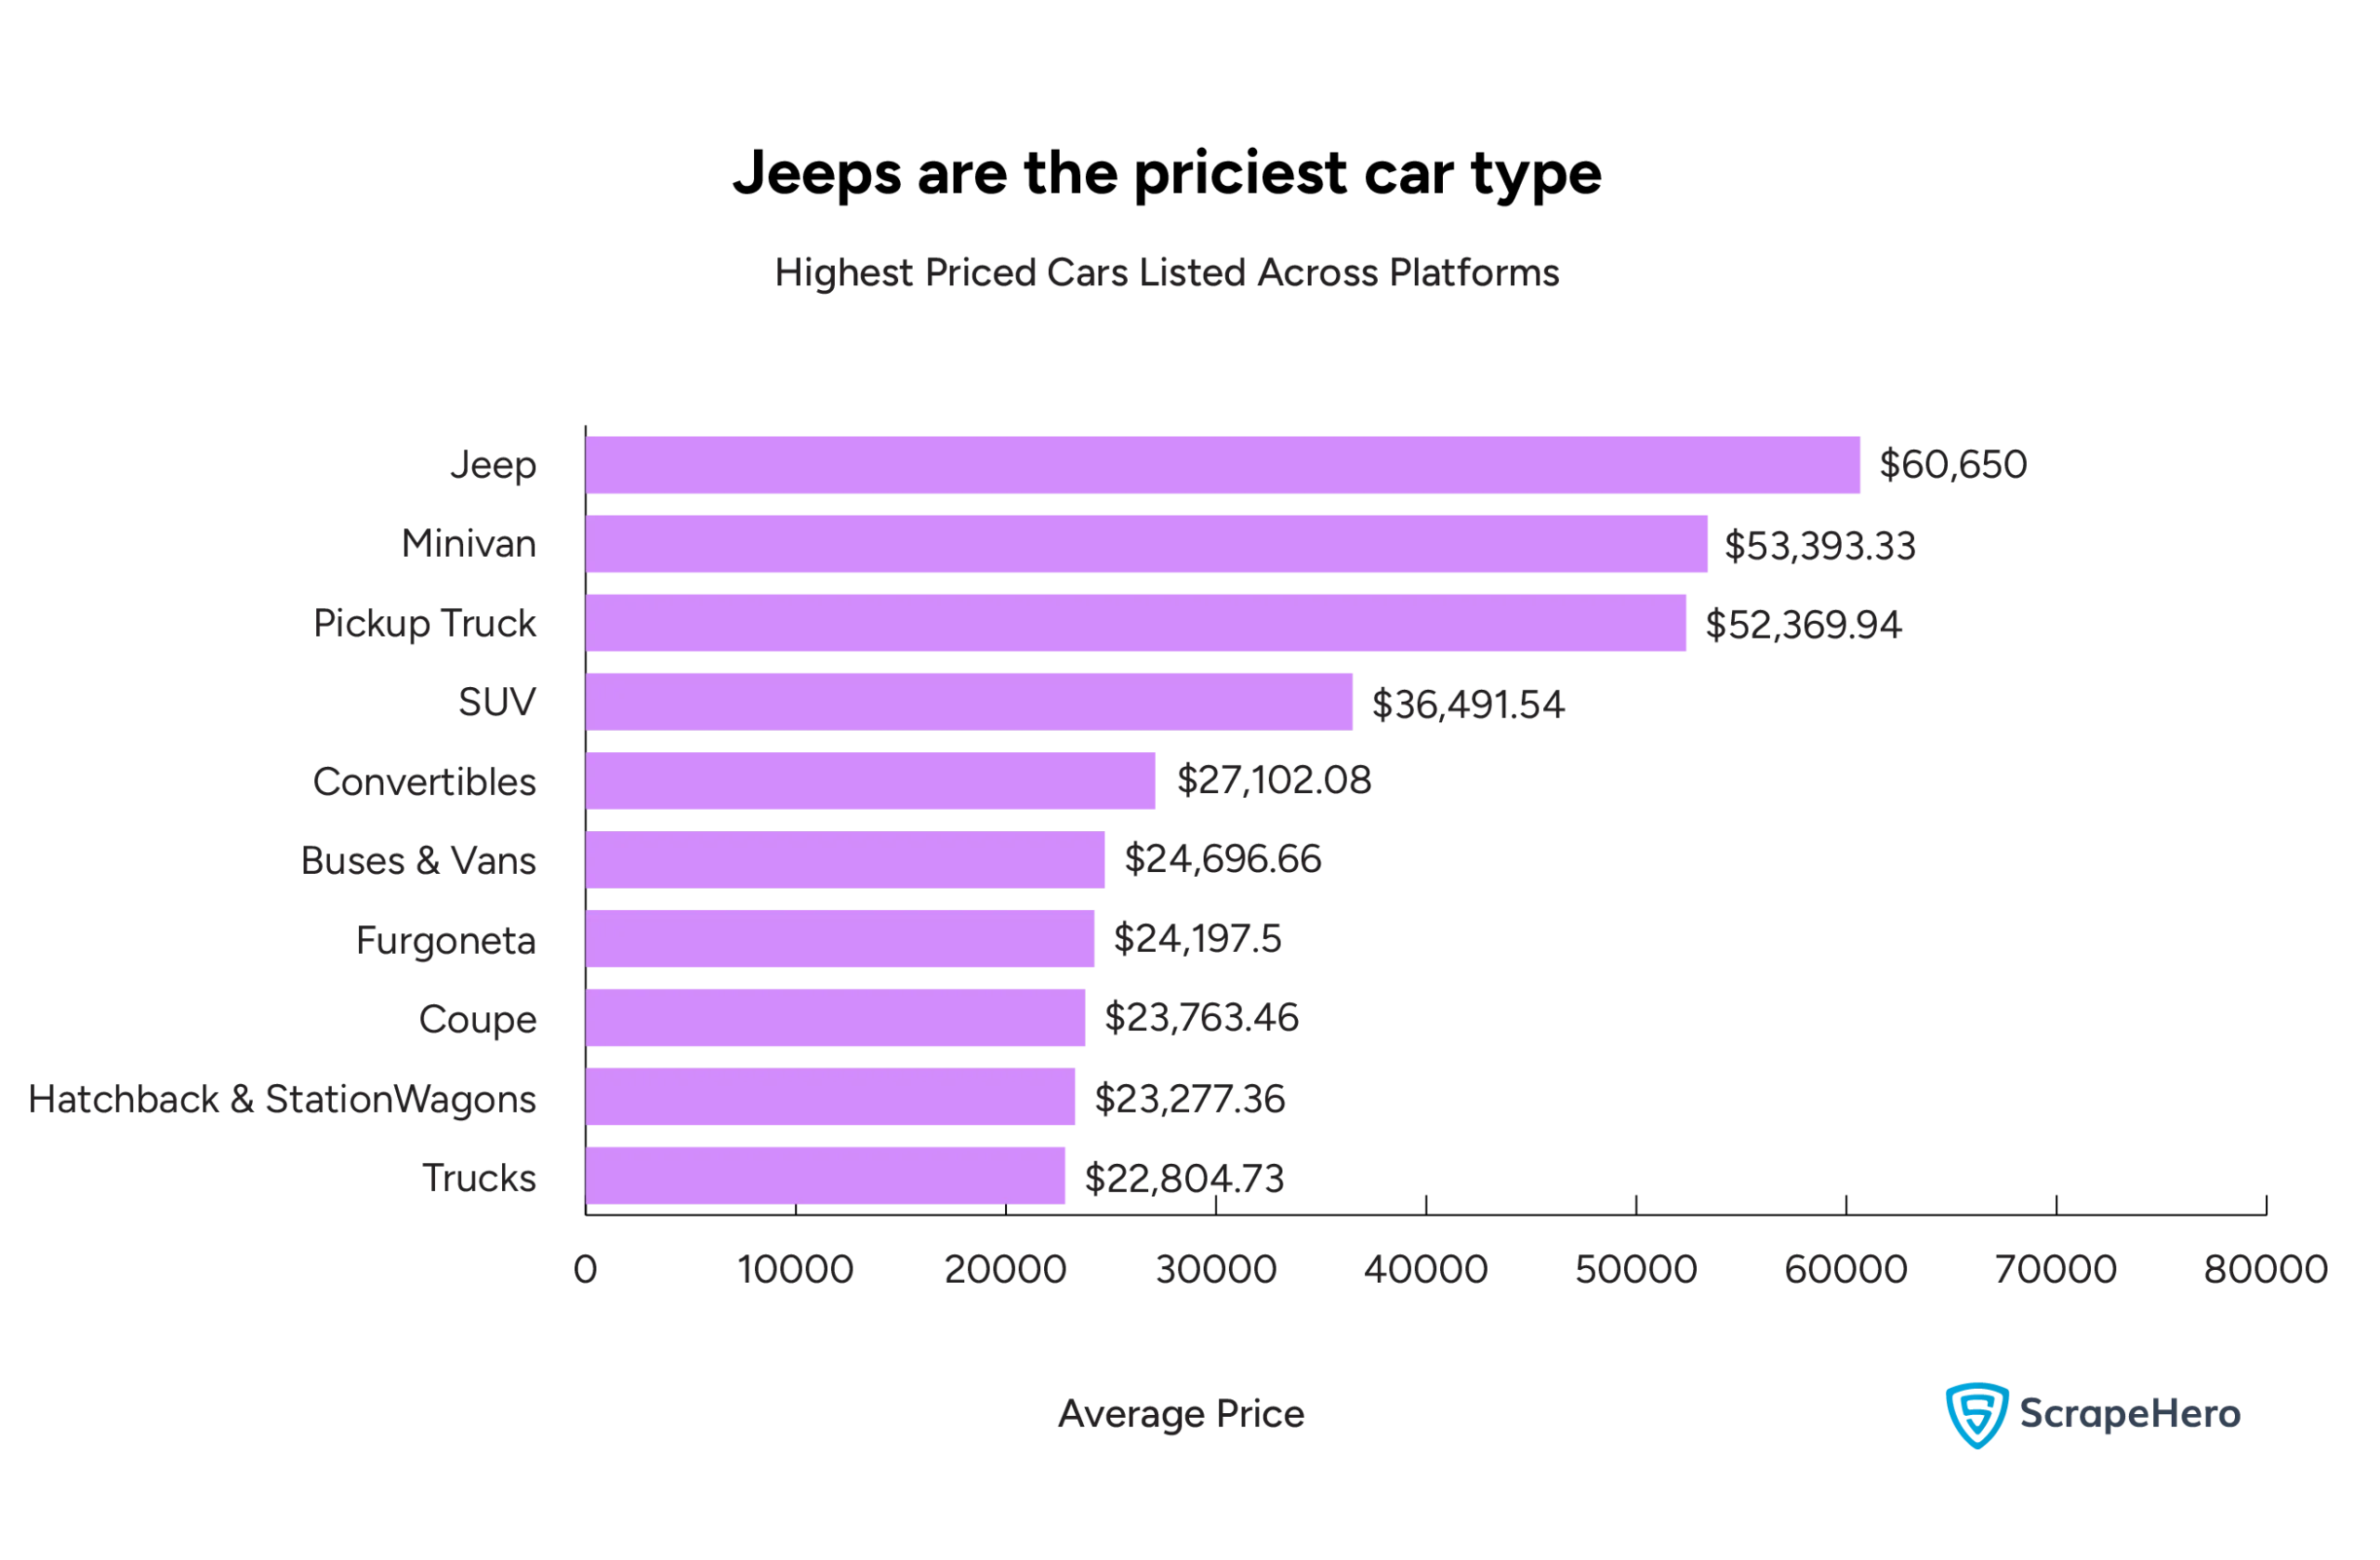
Pickup Trucks are also highly-priced, with an average of $52,369.94.
Coupes and Hatchback & Station Wagons are among the lower-priced categories, averaging $23,763.46 and $23,277.36.
The average price of trucks is $22,804.73, possibly indicating older models or trucks designed for budget-conscious buyers compared to the higher-end Pickup Trucks.
The high prices for Jeeps, Minivans, and Pickup Trucks suggest they are premium offerings.
Factors that Influence Car Prices
The prices of cars listed on the eight websites range from 0 to $10,000 to those above $80,000.
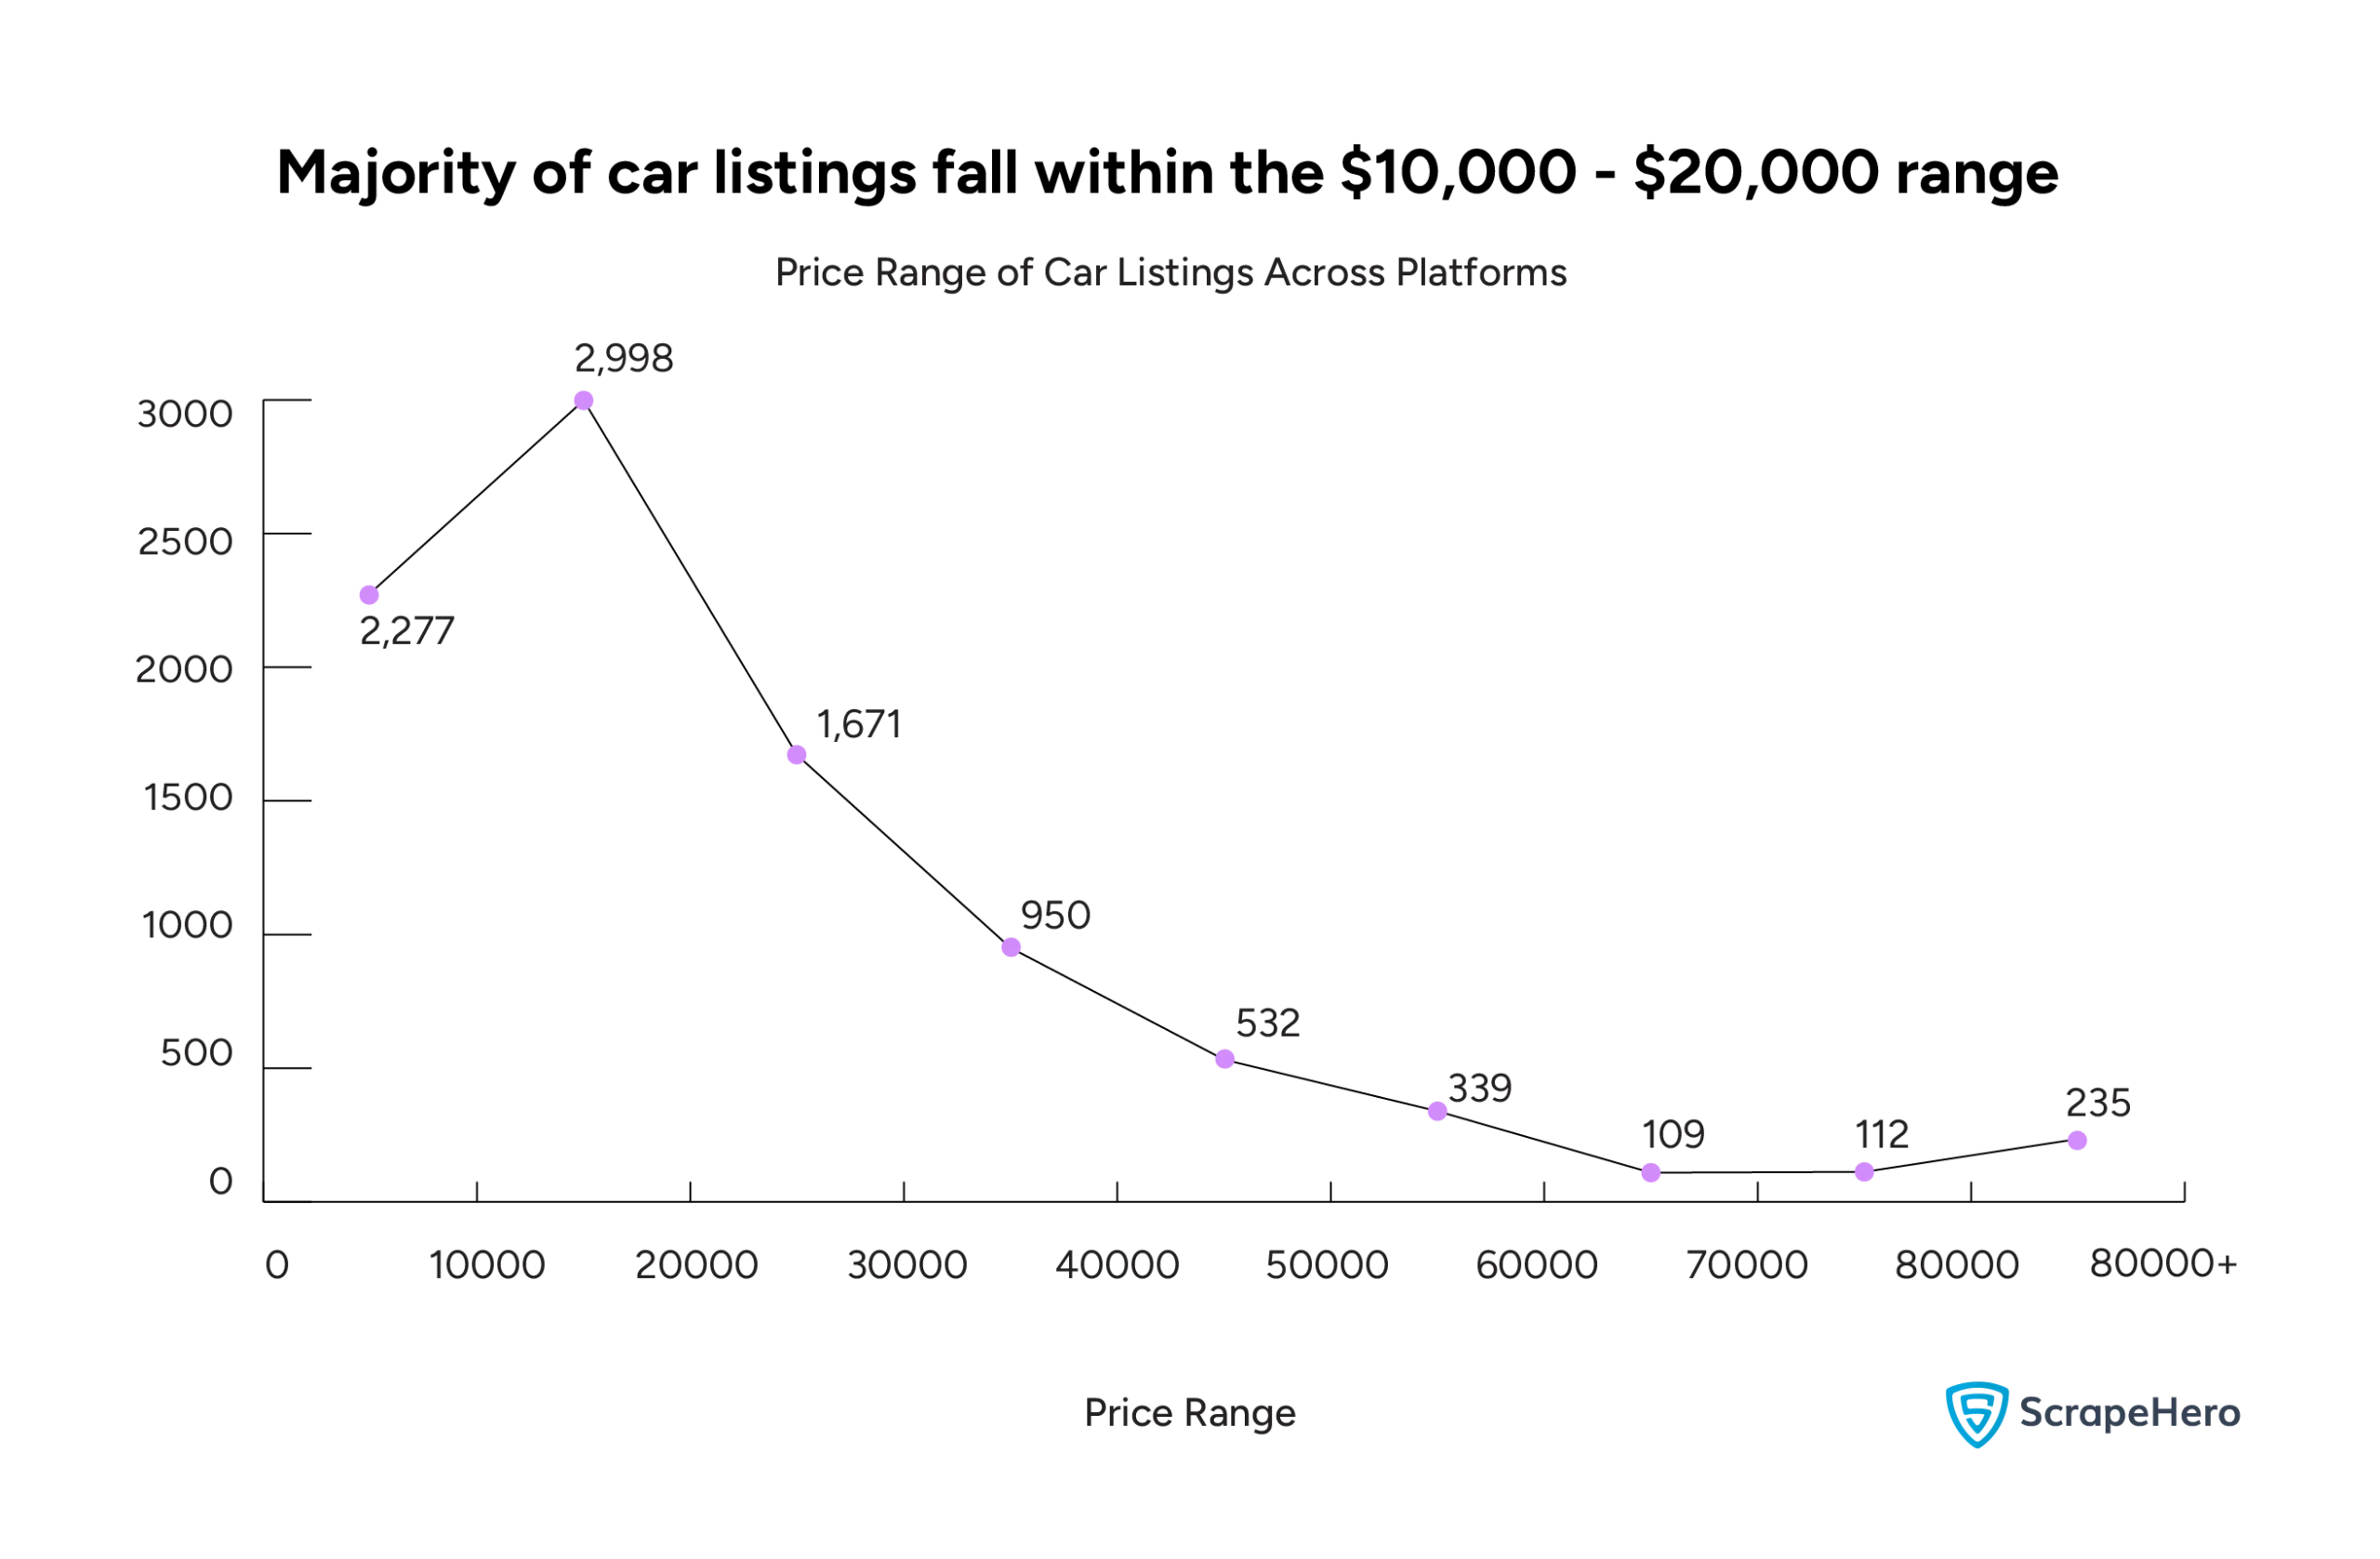
The majority of car listings fall within the $10,000 – $20,000 range, with 2,998 cars listed, making it the most popular price range.
This is closely followed by the $0 – $10,000 range, with 2,277 listings.
Together, these two categories represent the largest share, indicating a strong demand for more affordable vehicles.
Higher-priced cars (beyond $30,000) make up a smaller portion of the market.
The concentration of listings in the lower price ranges (under $30,000) suggests that the market is predominantly driven by affordability, with a larger share of consumers seeking budget-friendly or mid-range options.
Given the earlier data showing a high proportion of used vehicles (63.87%), many cars in the lower price brackets are likely to be used vehicles. This aligns with the preference for affordable vehicles observed in this graph.
New or imported vehicles may fall into higher price ranges, which are less represented in this chart.
Fuel Type
Our car data analysis revealed that gas-powered cars are the priciest category, with an average price of $36,612.13.
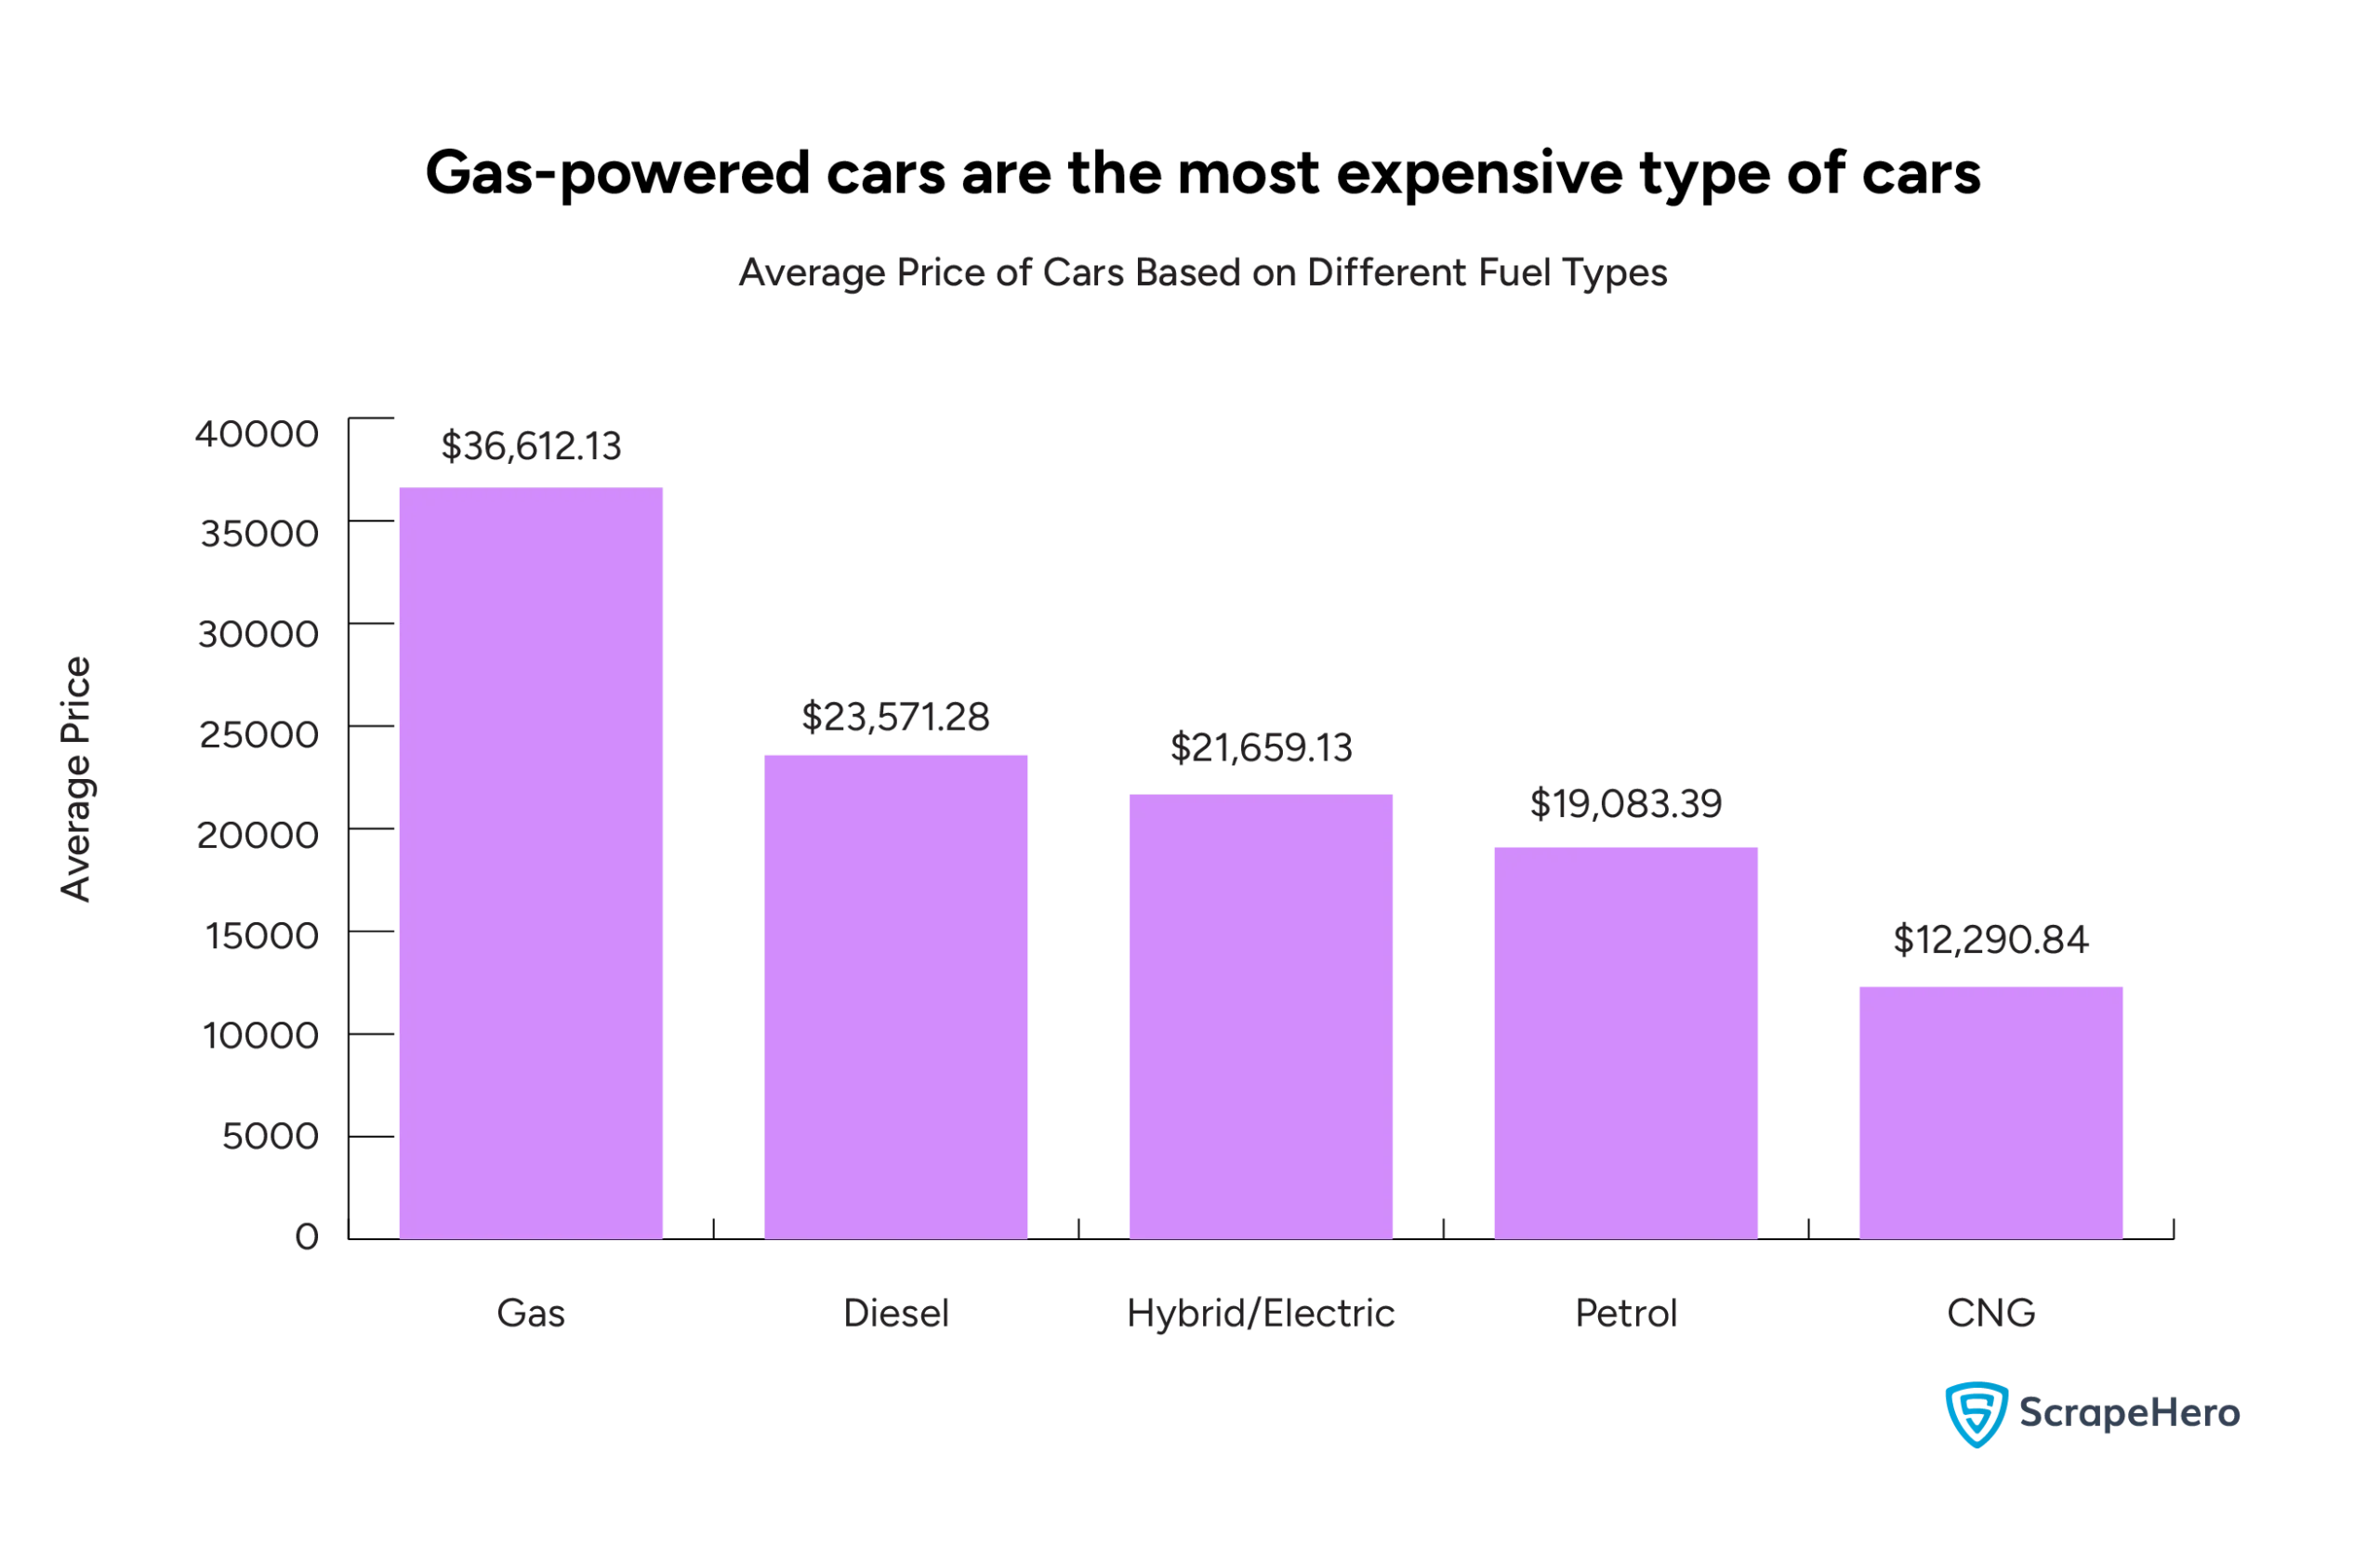
The average price of diesel cars is $23,571.28, while hybrid/electric vehicles are slightly lower at $21,659.13.
With an average price of $19,083.39, petrol vehicles are among the cheaper options.
CNG vehicles average $12,290.84, making them the least costly option.
There’s a growing demand for eclectic vehicles worldwide, driven by climate-conscious consumers, government incentives, and technological advancements. If you are interested, here’s a detailed analysis of the US electric vehicle market.
Manufacturing Year
Now, let’s see how the average prices of vehicles vary by their manufacturing year.
There is a clear upward trend in average prices as the manufacturing year approaches 2024. This indicates that, on average, newer cars are more expensive
This is expected as newer models often come with updated features, advanced technology, and improvements in safety and performance.
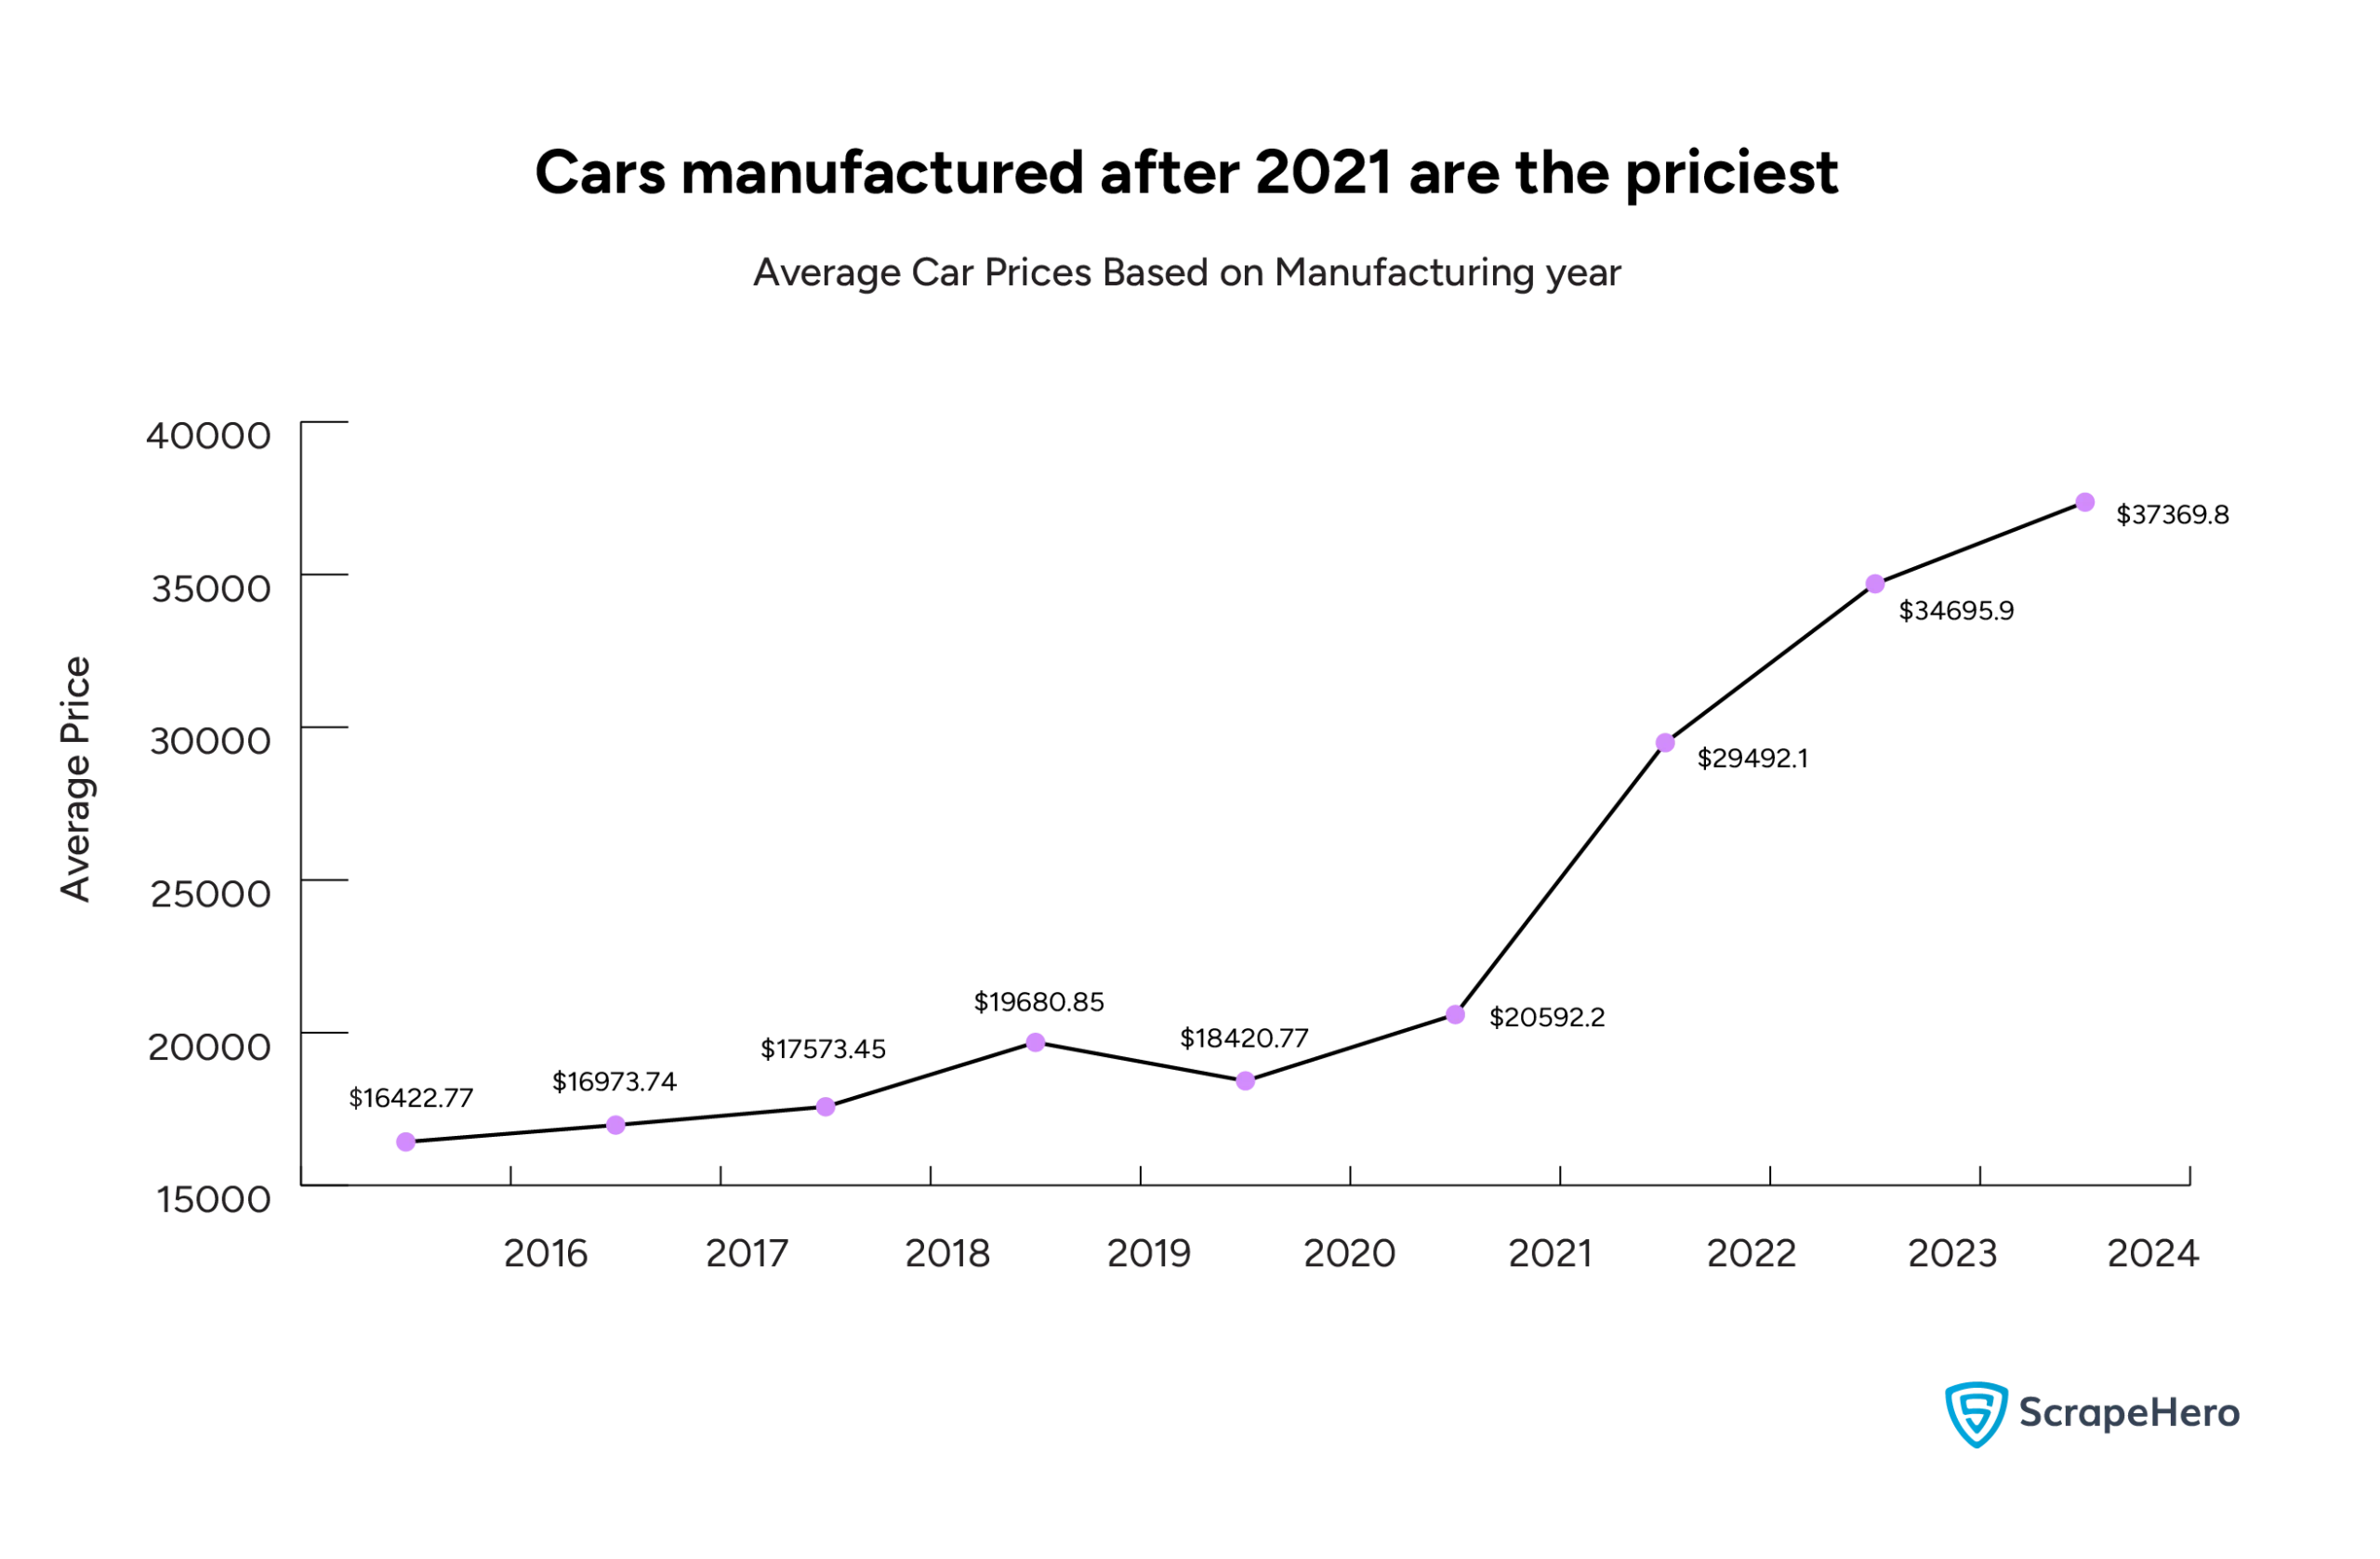
The average price increased only slightly from 2016 to 2020, ranging from around $16,000 to $18,000.
This suggests that vehicles from these years are relatively stable in price, possibly because they’re in the used car market where prices are more consistent due to depreciation.
From 2021 onward, average prices increased noticeably, with 2022 vehicles averaging close to $30,000 and 2024 models exceeding $37,000.
This jump confirms that newer models command higher prices.
Transmission Type
With an average price of $19,317.33, vehicles with automatic transmissions are significantly more expensive than those with manual or CVT (Continuously Variable Transmission) options.
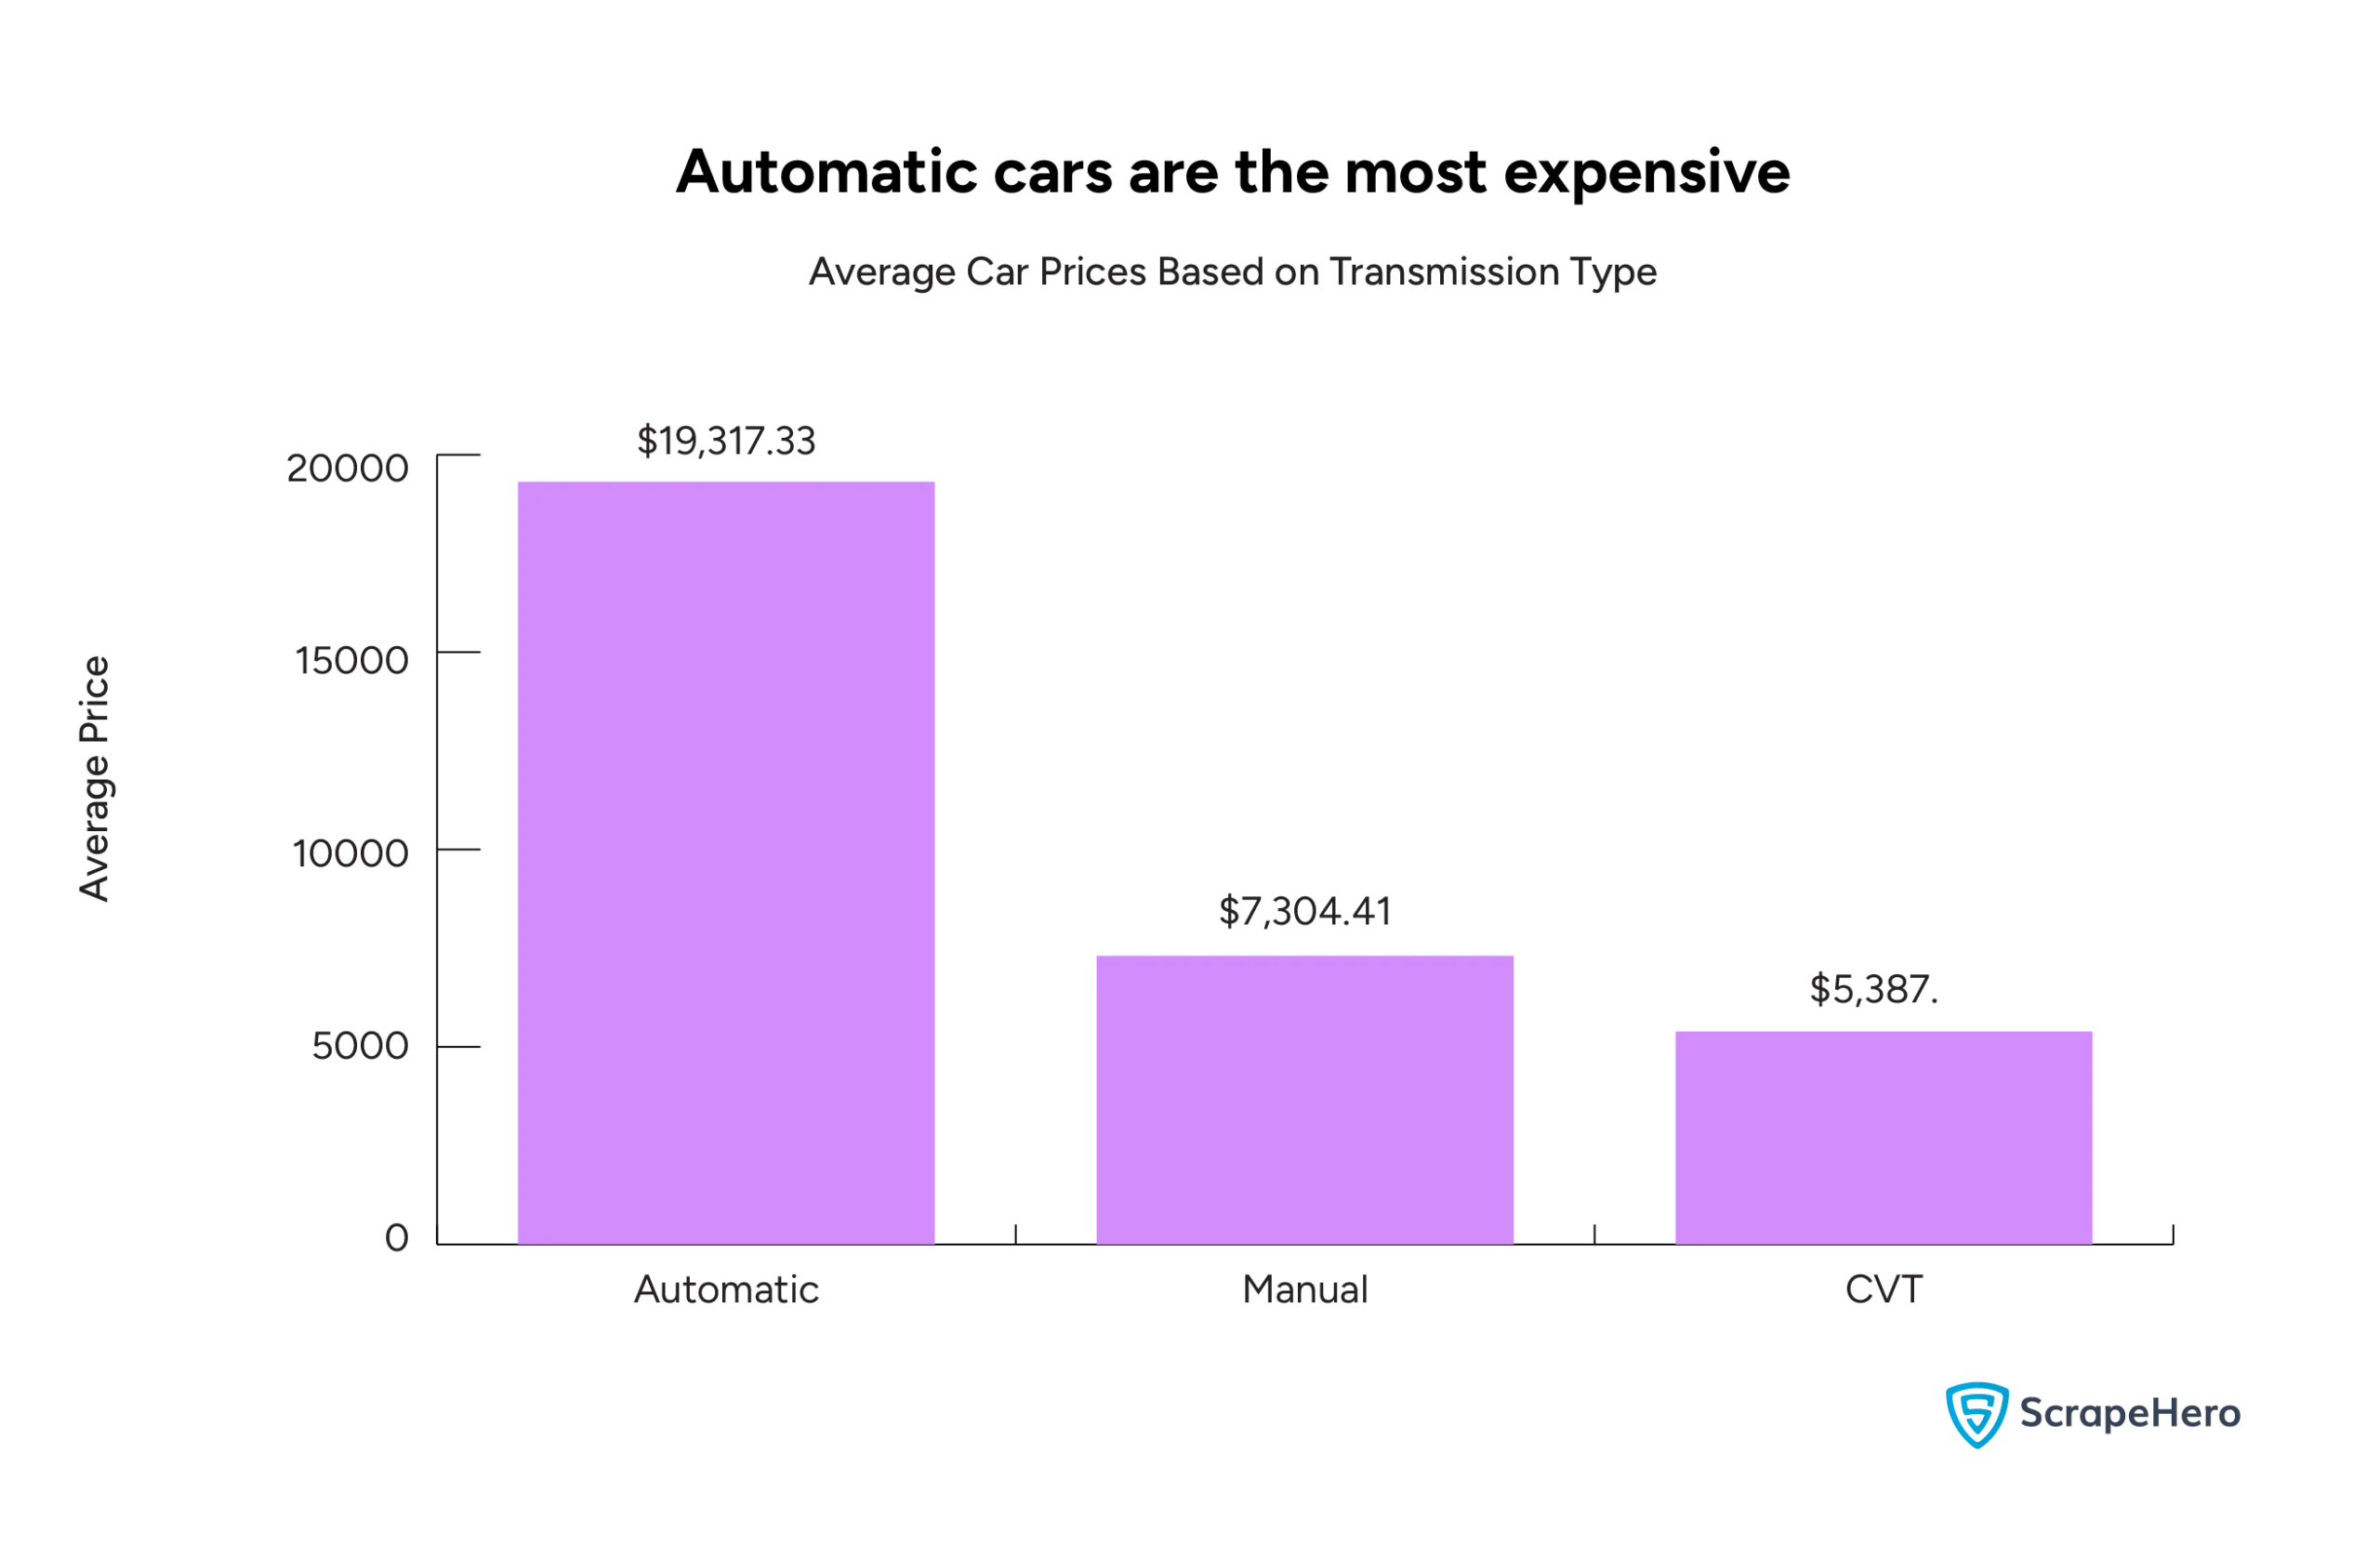
The average price of a car with manual transmission is $7,304.41. Manual transmissions are generally simpler in design and often preferred in older or economy models, which might explain the lower average price.
Vehicles with CVT have the lowest average price at $5,387.51.
CVTs are often used in smaller, fuel-efficient vehicles, which may have lower market value compared to larger, more feature-rich vehicles with automatic transmissions.
Color
Car color influences price, with popular or classic colors fetching higher prices, likely due to their association with luxury or high-demand models.
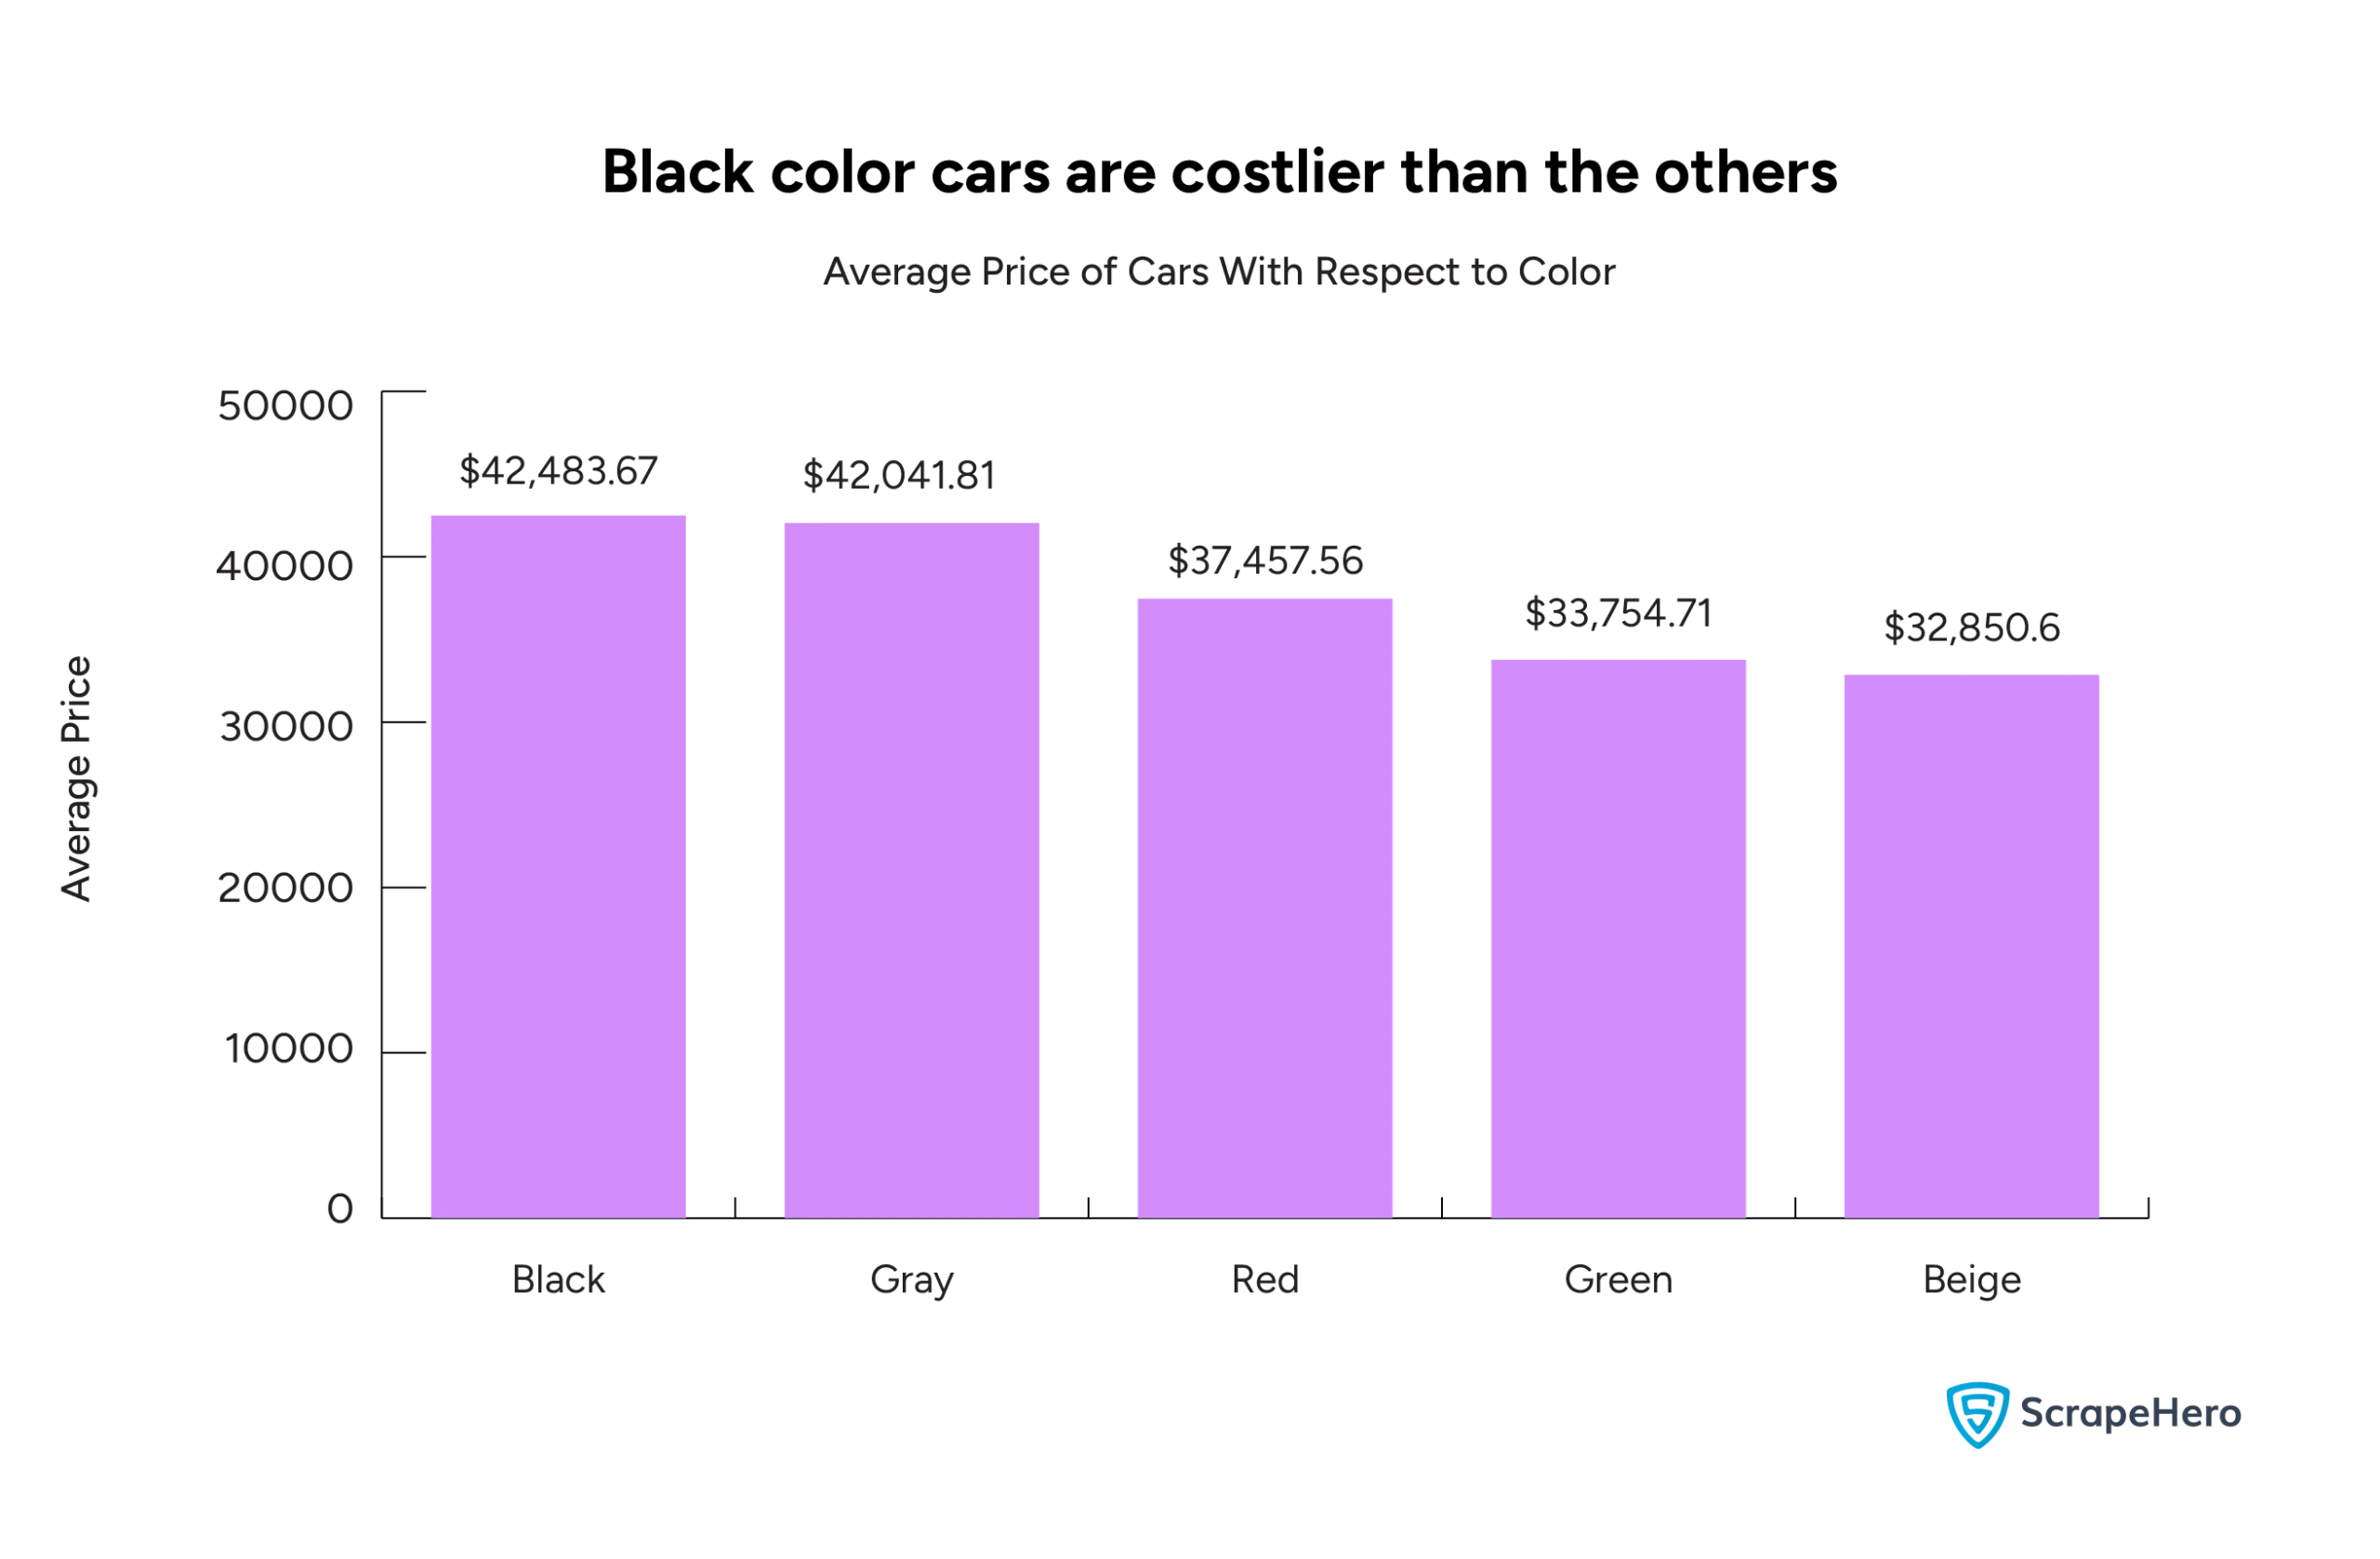
Black and gray cars have the highest average prices, at $42,483.67 and $42,041.81, respectively.
These colors are often associated with luxury vehicles, which could explain their higher price point.
Additionally, black and gray are popular, timeless colors, likely driving up their demand and price.
Vehicles in red average $37,457.56, placing them in the middle of the price range. Red is a popular color for sporty or performance-oriented models, which may contribute to its relatively high price compared to other colors.
Green and beige cars have the lowest average prices, at $33,754.71 and $32,850.6, respectively.
Final Thoughts on the Car Market of 2024
In conclusion, our car data analysis reveals a dynamic market influenced by consumer preferences and economic factors.
The used car market is dominant, with buyers favoring affordability. SUVs lead in listings and prices, reflecting a strong demand for spacious vehicles.
While budget-conscious buyers can find affordable options on platforms like tonitodoutlet.com, fuel type and manufacturing year significantly impact pricing, with gas-powered vehicles generally commanding higher prices.
Newer models post-2021 are also on the pricier side.
Additionally, classic colors like black and gray tend to be associated with higher prices.
By understanding these trends, both buyers and sellers can effectively navigate the evolving car market in 2024.
Want Data for Analysis?
By now, you likely recognize the importance of having data related to your area of interest. Data empowers you to analyze and comprehend trends and patterns.
However, collecting this data can be challenging. It often requires navigating complex sources, ensuring accuracy, and dedicating substantial time and resources to extract data consistently.
If you need data to understand the automotive industry or any other industry, we recommend partnering with an experienced web scraping service provider like ScrapeHero.
With over a decade of experience, unmatched quality and consistency, and the best crawling infrastructure, ScrapeHero is the best decision you can make for your web scraping needs.

