Given the changing times when buying, selling and trade has received an online face lift, it has become a necessity to play by the new rules. While retailers who hesitate to go online are slowly being phased out, those who have jumped on this bandwagon know very well that data optimization is the catalyst of future trade. Gathering data from e-commerce websites could help draw powerful insights into product introduction, buyer responses, seller behavior and market expansion. This blog uses some of the data we have gathered over the years about major e-commerce players to throw light on their growth curve.
Useful data points to make projections
There are websites of varying sizes, magnitude and content. E-commerce websites are usually on the heavier end of the spectrum due to the amount of data they harbor. Location, products, buying behavior, ratings and a million other dimensions can be gathered. Here are a few of the most useful ones:
1. Price details
We could start with collecting and comparing prices of products across multiple websites . For large and small sellers, this gives them an opportunity to understand market rates, and adjust their numbers accordingly. For example, if a different seller has put up a similar product as your for a lesser price, you would want to know.
Learn More: Scraping Prices from any E-commerce website
2. Product data
Observing how and what is being sold online provides huge insights about what is in demand. If products are added, reduced, if a player steps up competition; all this relevant research data can be recorded. For example, the Amazon Vs Walmart competition could be boiled down to how many products they are bringing on to the virtual shelf and how soon.
3. Market Expansion Data
Scraping also reveals data like store information, partnerships, and expansion plans by crawling not just the websites but also millions of news updates(though this depends largely on how good your infrastructure is). This comes handy while positioning your competitors and planning ahead of them.
4. Customer Feedback
Scraping customer ratings and reviews would tell you a lot about where a product stands on a website. Travel and real estate industry has been making use of this customer evaluation score for a while now. Let us say you are an online brand partnering with a retailing platform. If your partners are overpricing your product or not delivering the right product, it would reflect on the reviews and rating a customer leaves you. Large number of players rely on this information to understand where their brand and product stands in terms of customer satisfaction.
Case Studies
Putting together all the data we have been publishing since 2015, we managed to draw out few interesting patterns and comparisons between Amazon, Walmart, Amazon Now and Walmart Grocery, the four platforms that are spearheading the e-commerce wave for years now. Let us take a look at few insights.
Amazon.com – Product expansion
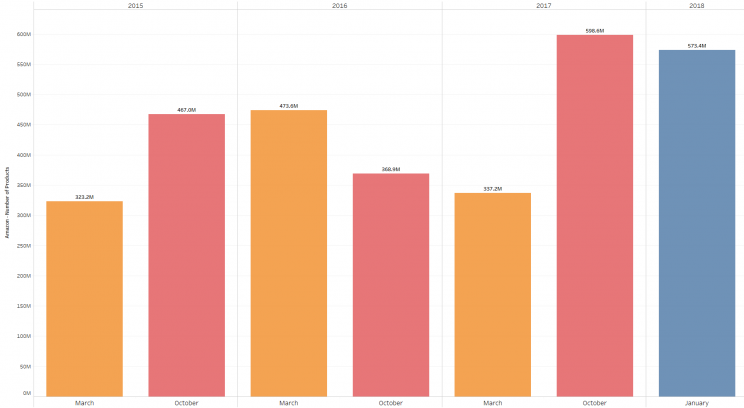
The graph below shows product expansion of Amazon.com since 2015. While the product count has increased significantly between the first and second quarter of 215, it has dropped over the second half of 2016 and first part of 2017. Amazon launched Prime Now in mid-2017 and this could have had an impact on the expansion graph of Amazon.com. Towards the end of 2017, the number shoot up, and then drops mildly in the beginning of 2018.
Amazon Worldwide sales
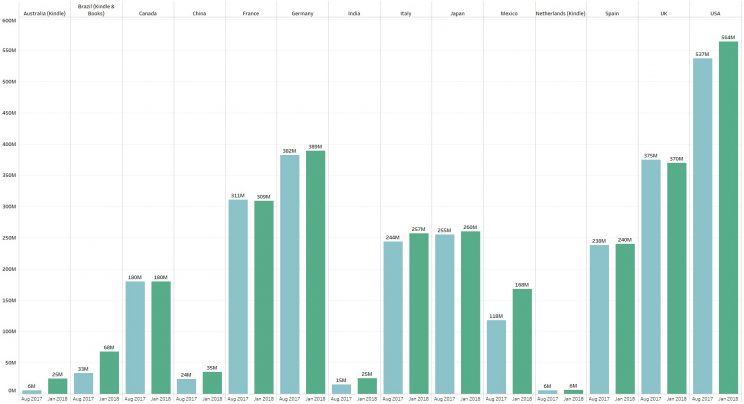
This next graph is a comparison of Amazon’s worldwide product count between 2017 and 2018. USA , Germany and UK are the countries with most number of products, and Japan, Italy and Spain fall next. Amazon has expanded it’s product count the most for US, Australia, Mexico, China and India over the past year, while it has dropped slightly in the UK. These numbers could be due to increased user sign up or an increment in the number of sellers in the area.
Amazon Prime Now Vs Walmart Grocery – The tightening war
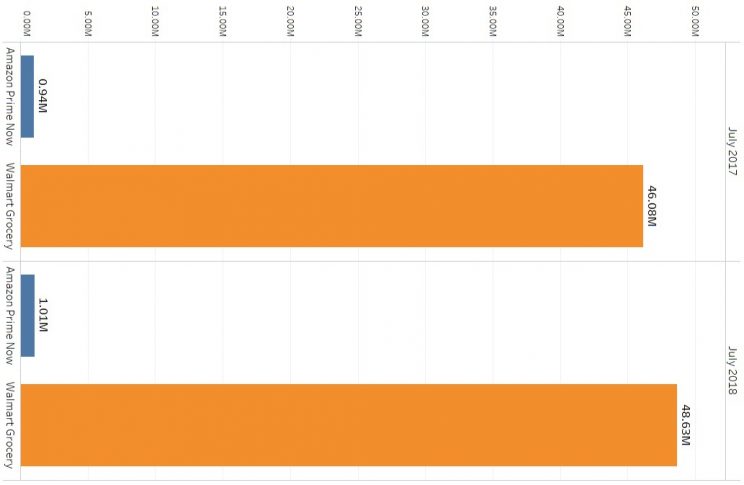
Though Amazon Prime Now started in 2017 and Walmart Grocery was born well into 2018, the difference in product counts between the two is a great indicator of an ongoing effort by
Walmart to undercut the pressure of competing with Amazon. Prime Now started off with less than a million products in 2017 and hasn’t made much progress a year later. Walmart grocery started off at 46 M products, marking itself the clear winner in this league.
Read the entire Amazon, Walmart data insights here
Tracking Buyer Patterns – Best Seller Ranks, Rating & Reviews
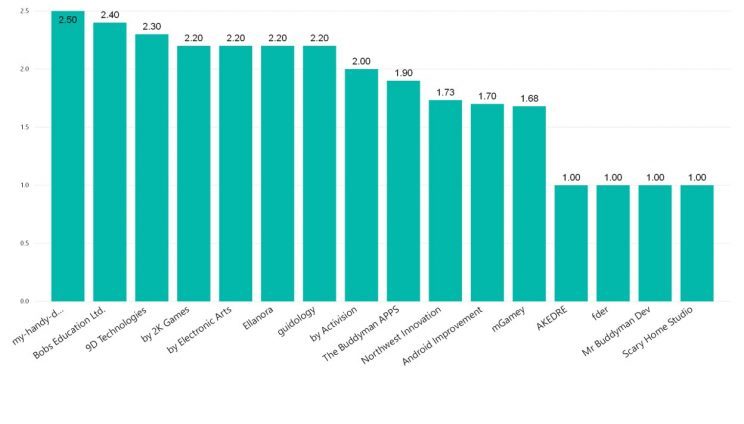
Quite recently, we made an effort to try and understand Bestseller ranks and how they are related to buying behavior and satisfaction. We found out that Reviews and ratings don’t have much impact on Bestseller ranks. Some of the least rated products and brands have made their way up to the Bestseller list. We made the following graph of products rated between 1 and 2 to be present on the Bestseller rankings.
Use cases for E-commerce data gathered
The potential that targeted, persistent scraping offers for e-commerce platforms are many. Alternative data has already become a must-have tool for investment firms, hedge funds and real estate firms to perform predictive analysis, monitor competition and to keep track of customer sentiments through social media and community platforms. For e-commerce industry, the benefits are a lot more direct.
1. Price optimization and customer evaluation
Many retailers are already using data science to price a product right and avoid giving unwanted discounts. For example, Amazon was known to changes its prices more than 2.5 million times a day, and it is done through price optimization algorithm that the company has been using for years. Many buyers aren’t as fussy about getting a discount as compared to being sold a faulty or low quality product. While juggling between multiple selling partners, it is very important for brands to understand what would make a buyer choose their product. Sure, price monitoring would help them price the product towards maximum purchases, but it is always better to be rated and reviewed well than to be simply cheapest.
2. The new tool for Commercial Due Diligence
What is Commercial Due Diligence
Commercial due diligence engagement conducts an analysis of the market environment and competitor’s position and its impact on a company’s business plan.
Data scraping can act as the backbone of commercial due diligence and market research for online retailers and e-commerce platforms. Referring to the projections we made above, it is quite clear how easily one can predict the growth, expansion, buyer and seller traffic and product mix of a brand. To cite an example, Walmart has been largely collecting information from sellers and buyers to tackle their competition Amazon, for couple of years now. By the end of 2017, Walmart closed the gap on pricing differences with Amazon averaging only .3% higher than Amazon.
Learn More: Lead Generation – Feeding your sales tunnel
We can gather price, product and other valuable data relevant for your website from a variety of websites. To know more, contact us on the form below.
We can help with your data or automation needs
Turn the Internet into meaningful, structured and usable data


